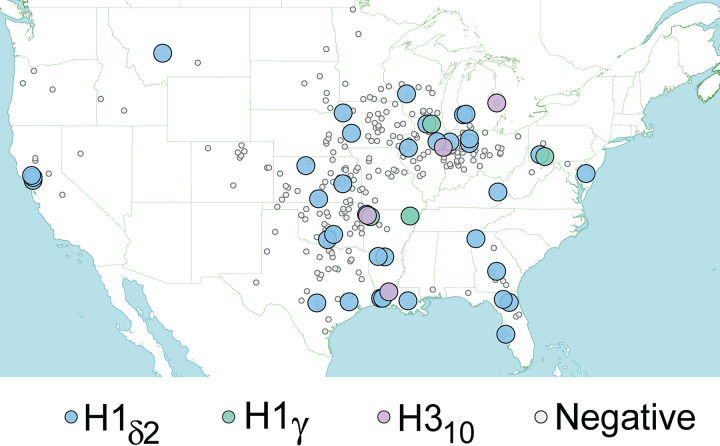
FIG 8.
Spatial distribution of exhibition swine infected with IAVs at an early-season national jackpot show. Each circle represents the home farm of a pig that attended the 2018 early-season national jackpot show and was tested for IAV. Small gray circles indicate pigs that tested negative for IAV. Large circles indicate pigs that tested positive for IAV, with the shade of the circle corresponding to the specific HA lineage.

