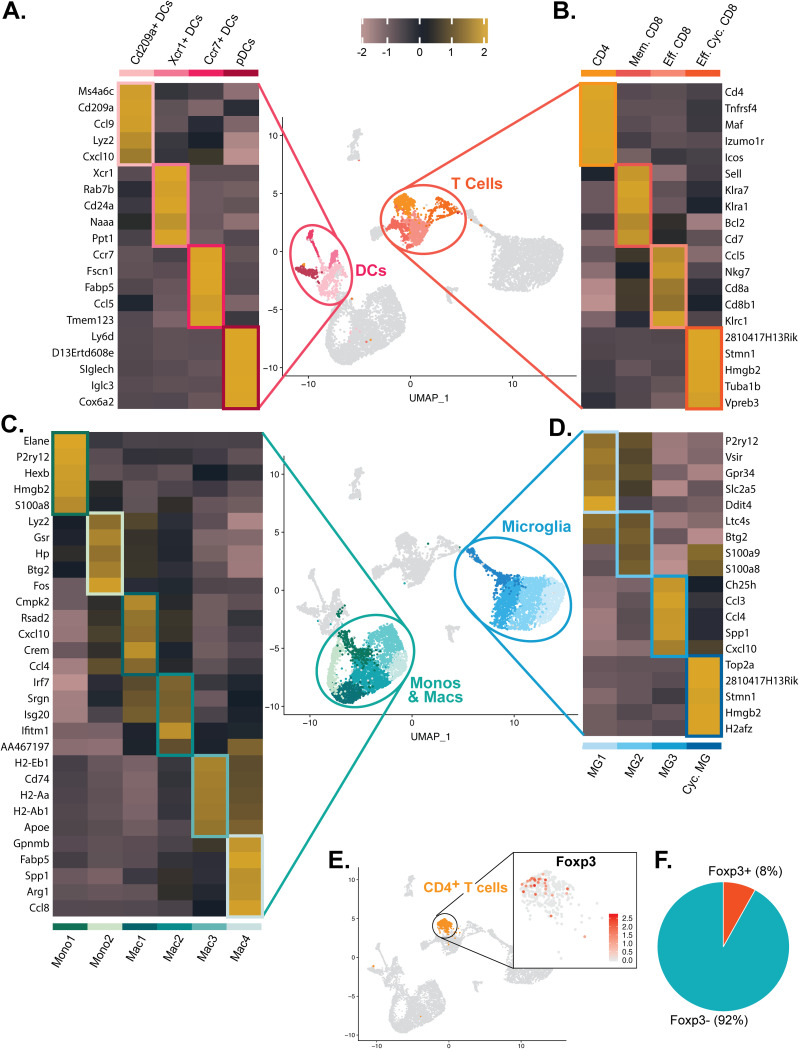
FIG 3.
Genetic signatures of immune cell subsets within the CNS of JHMV-infected mice. Heat maps show the top 5 transcripts differentially expressed between heterogeneous subpopulations for subsets of (A) dendritic cells, (B) T cells, (C) monocytes/macrophages, and (D) microglia. Each heat map was generated with subset data from (A) dendritic cells, (B) T cells, (C) monocytes/macrophages, and (D) microglia populations and isolated from all other clusters outside what is shown in each individual map. For panels A to D, data were aggregated from uninfected (Control) and infected mice at days 3, 7, and 21 p.i. Columns represent the different clusters, and rows represent expression of transcripts. (E) UMAP plot showing scaled expression of transcripts encoding FOXP3 (Foxp3) in CD4+ T cells. (F) Pie chart showing the percentage of Foxp3+ cells (red) versus Foxp3-negative (Foxp3-) cells (blue) within the CD4+ T cell cluster.

