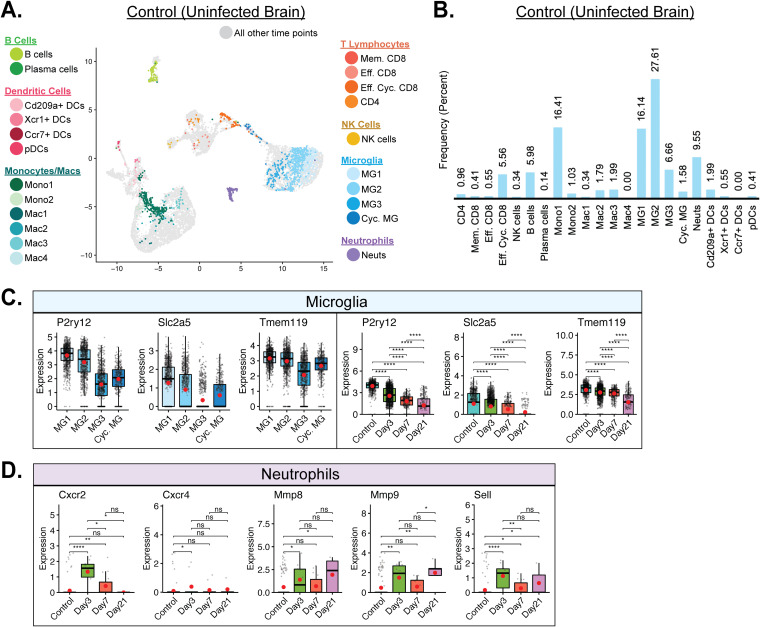
FIG 4.
Immune landscape in the uninfected CNS. (A) UMAP plot of cells within clusters exclusively from uninfected control brains. (B) Bar graph showing frequency of cell clusters within the brains of uninfected mice. Microglia represent the dominant cell types enriched within uninfected brains, followed by the monocyte subpopulation Mono1 and neutrophils. (C) Expression of P2ry12, Slc2a5, and Tmem119 transcripts by microglia (MG). Temporal analysis results represent aggregate data from subsets. (D) Temporal analysis of expression of transcripts encoding CXCR2/4 (Cxcr2/Cxcr4), MMP-8/9 (Mmp8, Mmp9), and l-selectin (CD62L, Sell), which are indicative of neutrophil activation. Transcript levels were elevated in defined times postinfection with JHMV. For the data presented in panels C and D, normalized expression values were used, and random noise was added to show the distribution of data points. The box plots show interquartile range and the median value (bold horizontal bar). Average expression value per sample is indicated by the red dots. Wilcoxon’s test was used for statistical analysis. ns, not significant; *, P ≤ 0.05; **, P ≤ 0.01; ****, P ≤ 0.0001.

