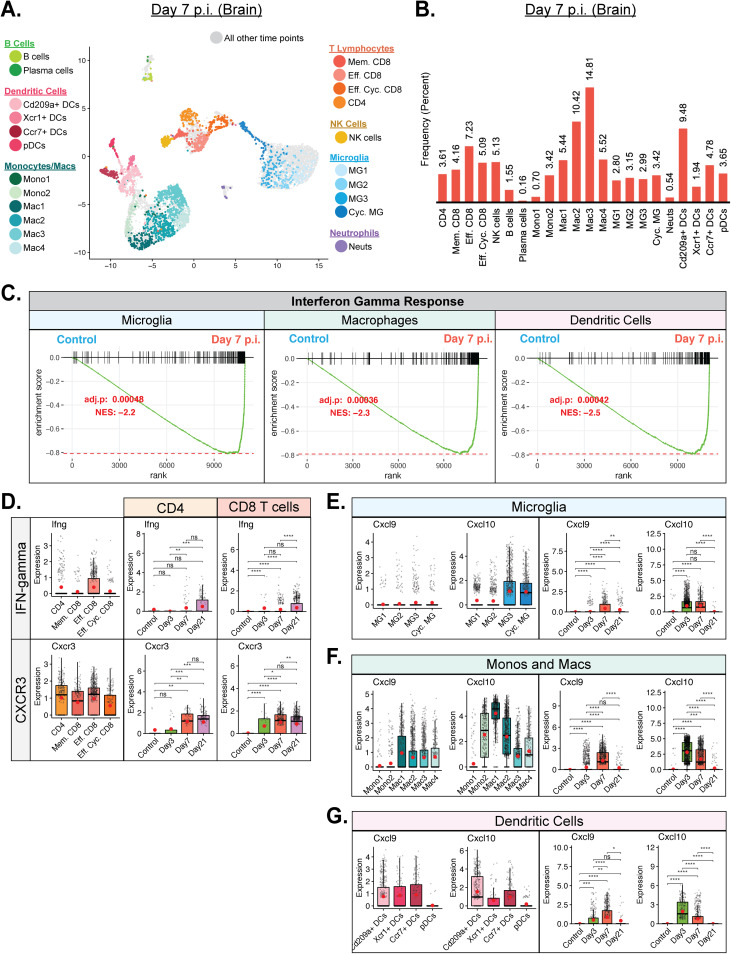
FIG 6.
T cell infiltration into CNS correlates with enriched IFN-γ response. (A) UMAP plot showing cells within clusters exclusively from brains at day 7 p.i. with JHMV. (B) Bar graph showing frequency of cells from a cluster within the brains of mice 7 days postinfection (p.i.) with JHMV. By day 7 p.i., there was an increase in T cell populations as well as in macrophage and dendritic cell (DC) subsets. (C) Gene set enrichment analysis (GSEA) for IFN-γ responses in microglia, macrophages, and dendritic cells at day 7 p.i. from brains of JHMV-infected mice. The area under the curve represents enrichment of response genes. Normalized enrichment scores and P values are shown. (D) Expression of Ifng and Cxcr3 transcripts by infiltrating T cell populations. (E to G) Expression of Cxcl9 and Cxcl10 transcripts in (E) microglia (MG), (F) subsets of monocytes (Mono) and macrophages (Mac), and (G) DC subsets. Temporal analysis results represent aggregate data from corresponding cell subsets. For the data presented in panels D to G, normalized expression values were used, and random noise was added. Box plots show interquartile range, median value (bold horizontal bar), and average expression value per sample (red dots). Wilcoxon’s test was used for statistical analysis. ns, not significant; *, P ≤ 0.05; **, P ≤ 0.01; ***, P ≤ 0.001; ****, P ≤ 0.0001.

