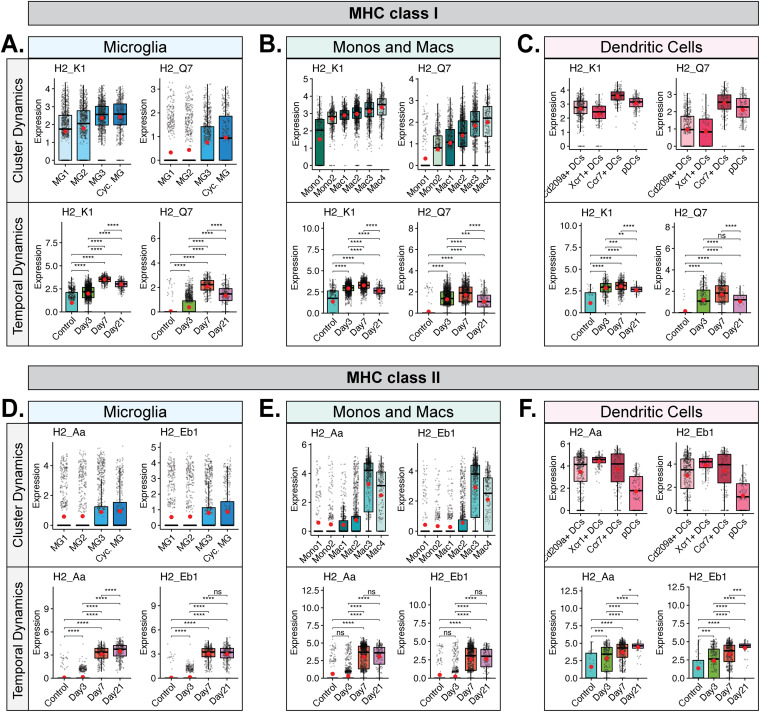
FIG 7.
MHC and T cell inhibitor expression in microglia, monocytes/macrophages, and dendritic cells. (A to C) Box plots showing expression of MHC class I-associated genes H2-K1 and H2-Q7 in subpopulations of (A) microglia, (B) monocytes and macrophages, and (C) dendritic cells. (D to F) Expression of MHC class II-associated genes H2-Aa and H2-Eb1 in subpopulations of (D) microglia, (E) monocytes and macrophages, and (F) dendritic cell subpopulations. In panels A to F, the top row demonstrates cluster dynamics and displays the aggregate data from all time points with regard to expression in subpopulations of cells, while the bottom row demonstrates temporal dynamics and shows overall expression of transcripts from the combined corresponding cell subtypes at defined times postinfection. Normalized expression values were used, and random noise was added. Box plots show interquartile range, median value (bold horizontal bar), and average expression value per sample (red dots). The Wilcoxon test was used for statistical analysis. ns, not significant; *, P ≤ 0.05; **, P ≤ 0.01; ***, P ≤ 0.001; ****, P ≤ 0.0001.

