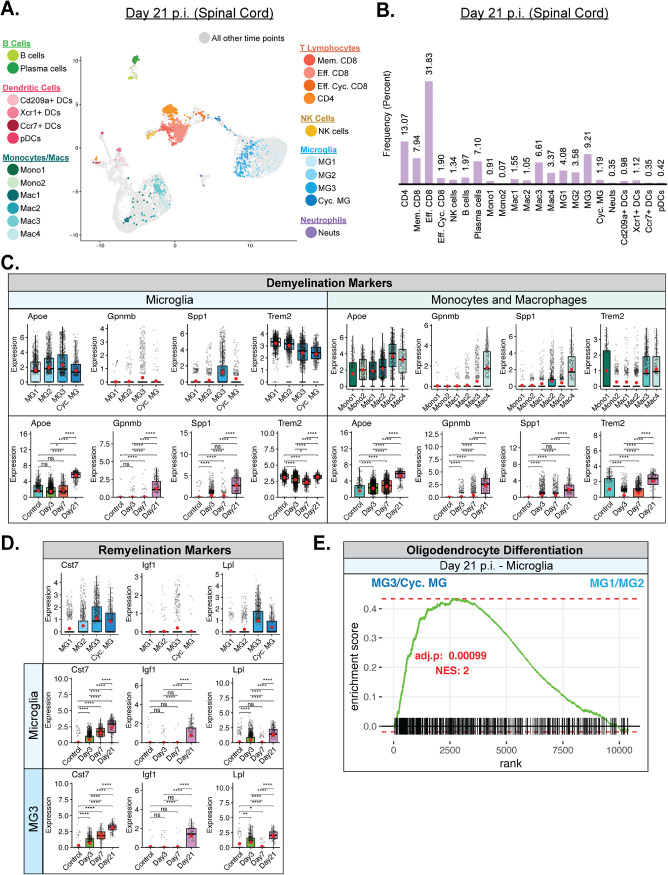
FIG 9.
Microglia contribute to T cell and macrophage-mediated chronic demyelination and promote remyelination. (A) UMAP plot showing cells within clusters exclusively from spinal cords at day 21 p.i. with JHMV. (B) Bar graph showing frequency of cells from a cluster within the spinal cords of mice at day 21 postinfection (p.i.) with JHMV. By day 21 p.i., there was an increase in populations of T cells and plasma cells as well as specific macrophage and microglia subsets. (C) Expression levels of transcripts of the Apoe, Gpnmb, Spp1, and Trem2 genes, which are associated with demyelination, were elevated in spinal cords at day 21 p.i. in specific subpopulations of microglia and macrophages. (D) Expression levels of remyelination markers Cst7, Igf1, and Lpl were also increased in specific subpopulations of microglia in spinal cords at day 21 p.i. with JHMV. For the data presented in panels C and D, temporal analysis results represent aggregate data from subsets. Normalized expression values were used, and random noise was added. Box plots show interquartile range, median value (bold horizontal bar), and average expression value per sample (red dots). Wilcoxon’s test was used for statistical analysis. (E) Gene set enrichment analysis (GSEA) of genes involved in promoting oligodendrocyte differentiation, comparing aggregated microglia subpopulations MG3 and cycling MG with MG1 and MG2 at day 21 p.i. from spinal cords of JHMV-infected mice. The area under the curve represents enrichment of involved genes. Normalized enrichment scores and P values are shown. ns, not significant; *, P ≤ 0.05; **, P ≤ 0.01; ****, P ≤ 0.0001.

