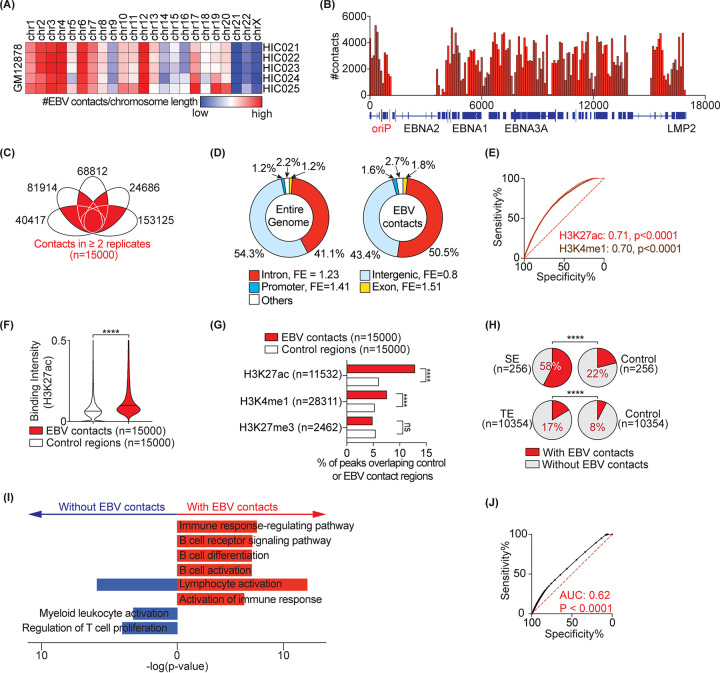
FIG 1.
EBV contacts are enriched in active regions of the host genome. (A) EBV interaction frequency with the host genome at the chromosomal level. (B) Distribution of contact frequency across the EBV genome. (C) 15,000 interactions between EBV and the host genome common to n ≥ 2 replicates. Each eclipse represents one Hi-C replicate in the GM12878 line. Data are from GSE63525. (D) Distribution of genomics elements (i.e., introns, exons, promoters, and intergenic regions) in the entire genome (left) and in the EBV contacts (right). FE, fold enrichment compared to the entire genome. (E) The receiver operating characteristics (ROC) curves distinguishing control regions (n = 15,000) from EBV contact loci (n = 15,000) based on the indicated histone marker. Numbers show the area under the curve (AUC) for each marker. Peak annotations are from ENCODE (31). (F) Violin plot comparing mean H3k27ac signal intensity in 15,000 control regions versus with EBV contacts. Median are highlighted by solid and dashed lines. (G) Bar-charts showing percentage of histone marker peaks that overlap with EBV contact or control regions. Fisher’s exact test: ****, P < 0.0001; ns, not significant. (H) EBV contact enrichment in super enhancer (SE) architectures (top) and typical enhancers (TE) (bottom). SE and TE annotations are from GM12878 (23). Percentages of regions interacting with EBV are shown. Controls are size-matched regions randomly selected across the entire genome. (I) Pathway analysis of SE-containing genes with and without EBV contacts using Metascape. The selected top 8 pathways are highlighted. (J) ROC curves distinguishing control regions from EBV-interacting regions based on all open chromatin regions annotated from ATAC-seq (GSE103301) in GM12878.

