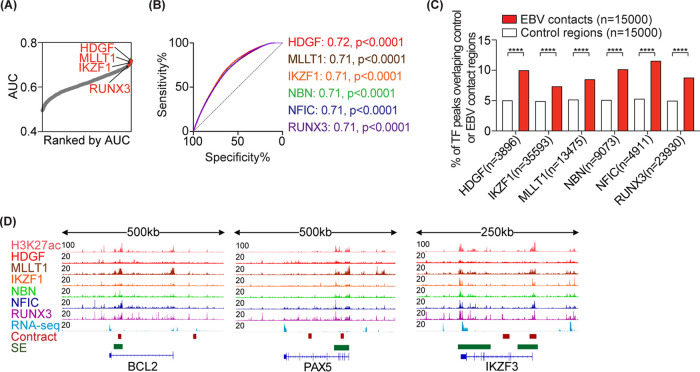
FIG 2.
EBV-contact regions are bound by key host transcription factors. (A) AUCs showing the power of each TF to distinguish EBV contacts (n = 15,000) from control regions (n = 15,000). The top TFs with higher binding signals in EBV contacts than in control loci are highlighted. (B) ROC curves showing the specificity and sensitivity of the indicated top TFs in discriminating EBV contacts from control loci. AUC values and their P values are indicated. (C) Bar chart showing the percentage of TF peaks that overlap with EBV contacts versus control regions. Fisher’s exact test: ****, P < 0.0001. (D) ChIP-seq tracks for three representative loci with one or more EBV contacts and SE.

