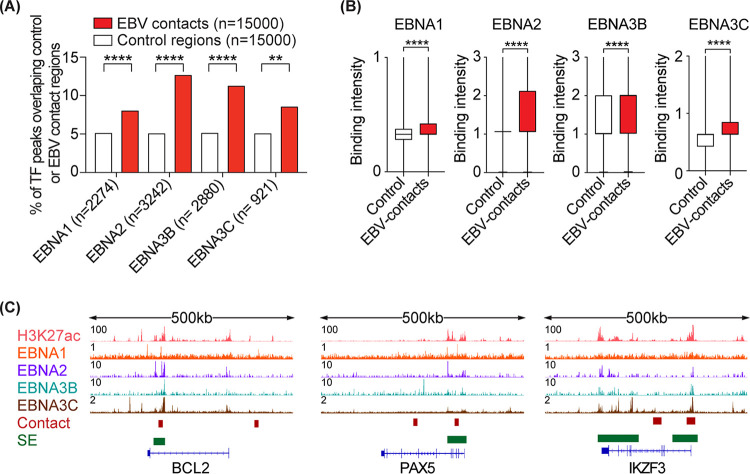
FIG 3.
EBV-contact host regions are bound by viral transcription factors. (A) Bar chart showing the percentage of TF peaks that overlap with EBV contacts versus control regions. Fisher’s exact test: ****, P < 0.0001. (B) Boxplots comparing the maximum binding intensity of the indicated TF in EBV contacts versus control regions. Two-tailed Mann-Whitney test: ****, P < 0.0001. (C) ChIP-seq tracks for three representative loci.

