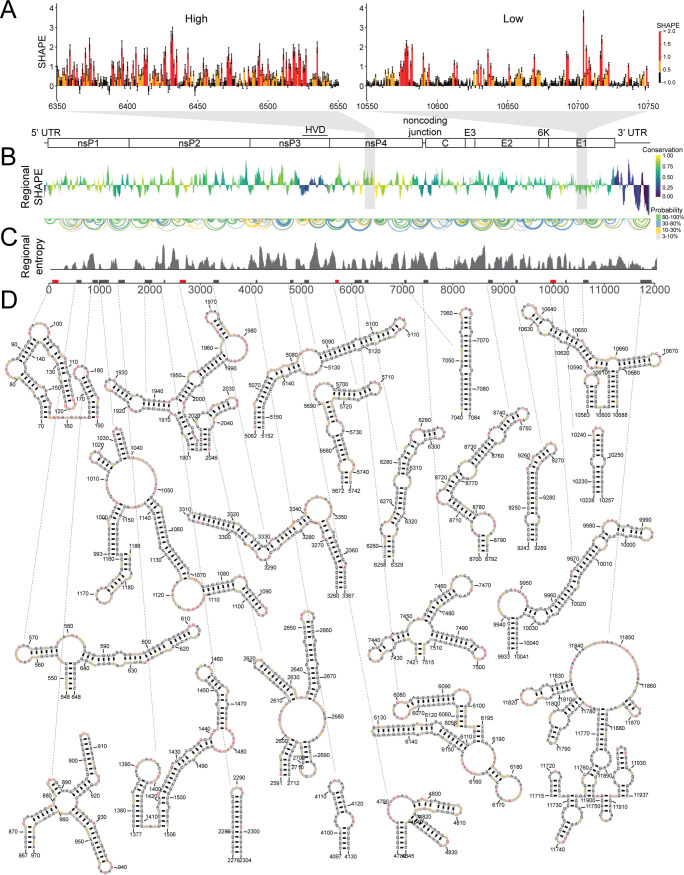
FIG 1.
SHAPE-MaP indicates specific RNA secondary structures are found throughout the CHIKV genome. (A, left) Example of SHAPE reactivities in ahigh-SHAPE, unstructured region. (Right) Example of SHAPE reactivities in a low-SHAPE, very structured region. Although individual reactivities do not reveal local structure, the pattern of reactivities in a region provides information about structuredness within that region. (B, top) Cartoon of the CHIKV genome. (Bottom) Regional median SHAPE reactivities across the CHIKV genome compared to the global median SHAPE. Regions below the x axis indicate more structure than average, while regions above the x axis indicate less structure than average. The histogram is colored according to the regional conservation score using representative full-genome sequences across the alphavirus genus (8, 27). Yellow indicates highly conserved regions, and purple indicates less conserved regions. HVD, hypervariable domain. (C, top) Base pairs within CHIKV genome. The color indicates base pairing probability. (Bottom) Windowed Shannon entropy across the genome. Low Shannon entropy values correspond to regions that form a single structure. (D, top) Boxes along the genome indicate highly structured regions, as determined by both computational prediction and experimental reactivities. Red boxes indicate structured regions with previously known functional importance. Black boxes indicate novel structured regions. (Bottom) SHAPE-MaP informed secondary structure models of highly structured regions. Nucleotide color corresponds to SHAPE reactivity scale in panel A.

