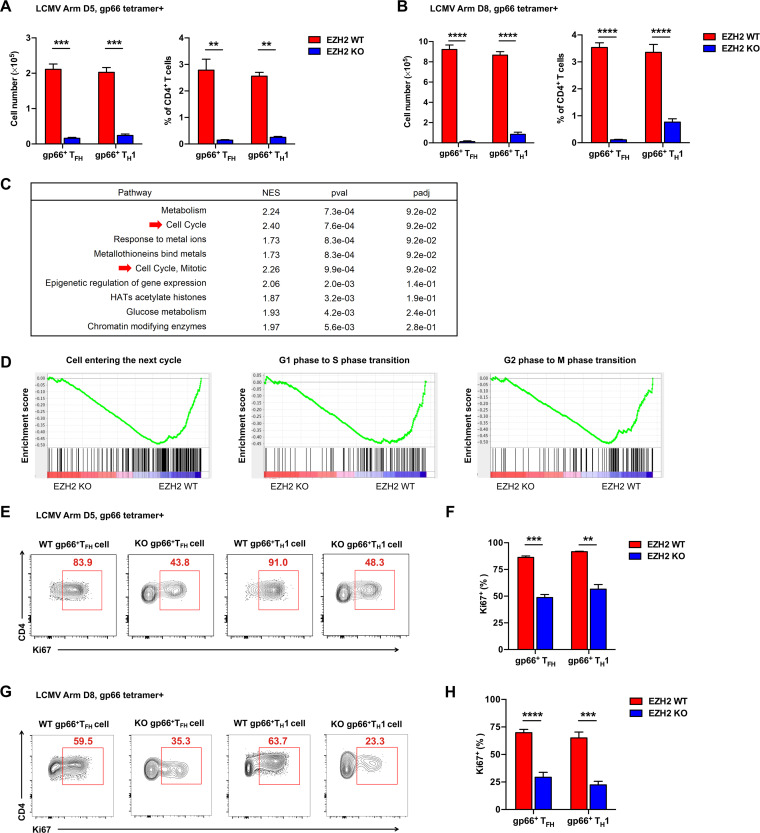
FIG 2.
Efficient CD4 T cell expansion is coordinated by EZH2. Total number (left) and frequency (right) of GP66 tetramer+ TFH and TH1 cells from the spleens of Ezh2fl/fl (EZH2 WT) or Ezh2fl/flCd4-Cre (EZH2 KO) mice on day 5 (A) or day 8 (B) after infection. (C) Unbiased GSEA analysis of gene signatures between EZH2 WT and EZH2 KO CD4 T cells at day 8 after LCMV Armstrong infection (GEO accession code GSE110458). (D) GSEA analysis of gene signatures for cell cycling between EZH2 WT and EZH2 KO CD4 T cells at day 8 after LCMV Armstrong infection (GEO accession code GSE110458). (E) Flow cytometry analysis of GP66 tetramer+ TFH and TH1 cells from the spleens of EZH2 WT or EZH2 KO mice described for panel A. Numbers adjacent to the outlined areas indicate the proportions of Ki67-positive cells, which are summarized in F. (G) Flow cytometry analysis of GP66 tetramer+ TFH and TH1 cells from the spleens of EZH2 WT or EZH2 KO mice described for panel B. Numbers adjacent to the outlined areas indicate the proportions of Ki67-positive cells, which are summarized in H. **, P < 0.01; ***, P < 0.001; ****, P < 0.0001 (unpaired two-tailed t test). Data are representative of two independent experiments with at least 4 mice per group (for A, B, F, and H, error bars are standard errors of the means [SEMs]).

