FIG 6.
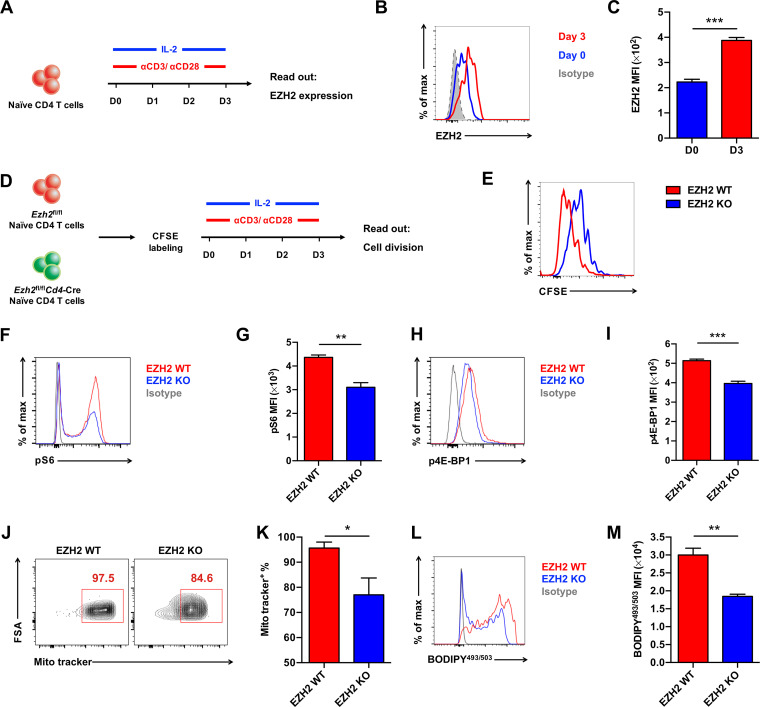
The EZH2-mTOR axis is activated by TCR engagement. (A) Experimental setup. Naive CD4 T cells from the spleens of C57BL/6J mice were cultured in vitro with αCD3/αCD28 antibodies and IL-2. (B) Flow cytometry analysis of EZH2 protein expression levels in CD4 T cells at day 0 and day 3 in culture, which are summarized in C. (D) Experimental setup. Naive CD4 T cells from the spleens of Ezh2fl/fl (EZH2 WT) or Ezh2fl/flCd4-Cre (EZH2 KO) mice were first labeled with CFSE. Next, CFSE-labeled CD4 T cells were cultured in vitro and analyzed on day 3. (E) Flow cytometry analysis of CFSE-labeled CD4 T cells described in D. (F) Flow cytometry analysis of pS6 expression in CD4 T cells in experiments described in panel D, which are summarized in G. (H) Flow cytometry analysis of p4E-BP1 expression of CD4 T cells in experiments described in panel D, which are summarized in I. (J) Flow cytometry analysis of MitoTracker-positive CD4 T cells in experiments described in panel D. Numbers adjacent to the outlined areas indicate MitoTracker-positive proportion of cells, which are summarized in K. (L) Flow cytometry analysis of BODYPY493/503 expression levels in CD4 T cells in experiments described in panel D, which are summarized in M. *, P < 0.05; **, P < 0.01; ***, P < 0.001 (paired two-tailed t test). Data are representative of two independent experiments (for C, G, I, K, and M, error bars are SEMs).

