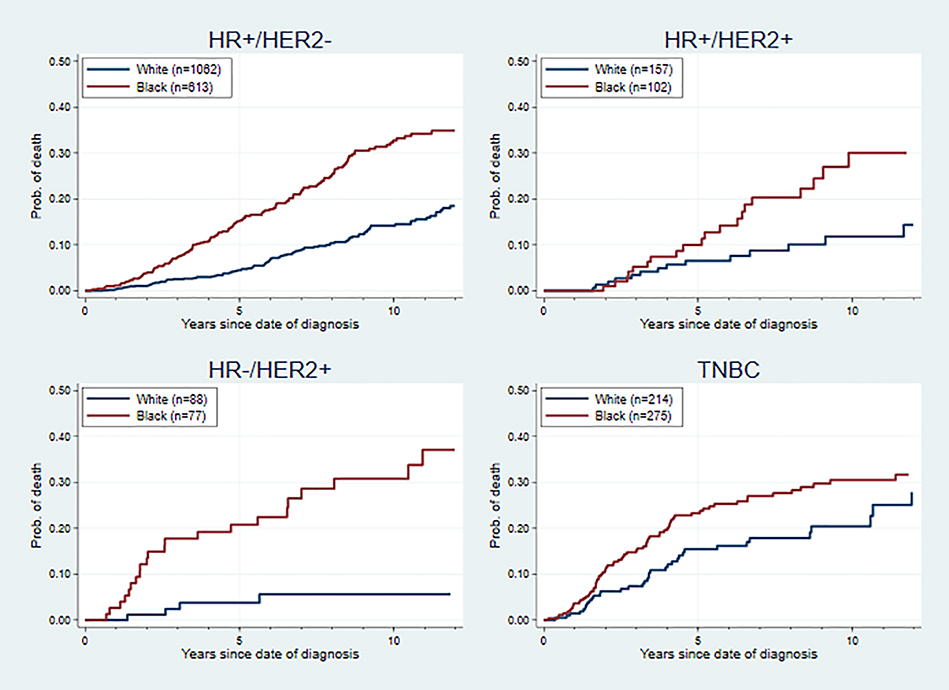
Figure 1. Overall Survival Curve for Black and White Patients by Breast Cancer Subtype.
Cox proportional hazards models were used adjusting for age at diagnosis, cancer stage, PR status and comorbidities in HR+/HER2− and HR+/HER2+ subtypes; adjusting for age at diagnosis, cancer stage and comorbidities in HR−/HER2+ and TNBC subtype. The adjusted hazard ratio (95% CI) was 1.56 (1.22–2.00) for HR+/HER2− subtype, 1.42 (0.74–2.70) for HR+/HER2+ subtype, 4.00 (1.47–10.86) for HR−/HER2+ subtype, and 1.26 (0.84–1.88) for TNBC subtype.

