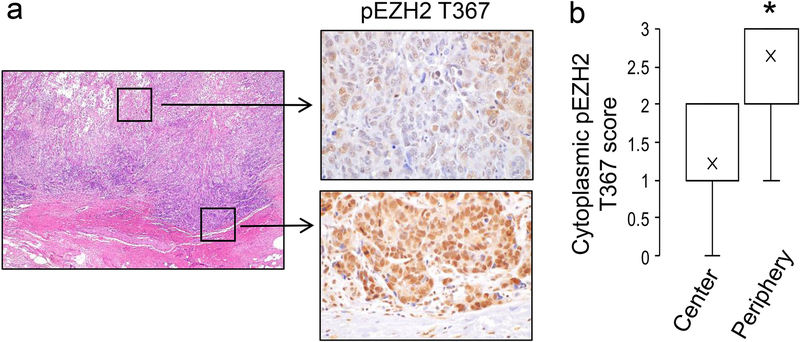
Figure 2. Metaplastic carcinomas show accentuated cytoplasmic pEZH2 T367 at the infiltrative edge compared to the center of the tumor.
a. Representative images of a metaplastic carcinoma with squamous differentiation demonstrating upregulated expression of cytoplasmic and nuclear pEZH2 T367 at the infiltrative edge, compared to the low expression in the center of the tumor (H&E 2x, pEZH2 T367 40x). b. Bar graph shows quantification of the staining intensity for cytoplasmic pEZH2 T367 at the center and the periphery of whole sections of 25 tumors with available tumor-normal interface (average intensity score 2.7 vs. 1.2 at the periphery and center, respectively, p<0.001).

