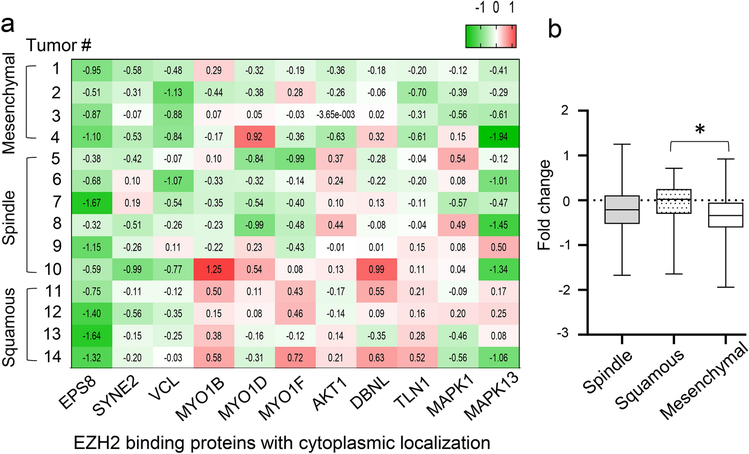
Figure 4. Expression of EZH2 cytoplasmic interacting proteins in metaplastic carcinomas using unsupervised protein expression analysis.
a. Heatmap showing increased expression of reported EZH2 cytoplasmic interacting proteins in squamous compared to mesenchymal subtypes of metaplastic carcinoma. The heatmaps shows fold change values of each patient relative to the average of normal breast tissues. Key markers for each hallmark signature have been previously reported [20, 25, 33–38]. b. Bar graph shows quantification of fold change in protein expression according to histological metaplastic carcinoma subtype. One-way ANOVA statistical analyses were performed between each subtype, where p<0.05 was considered significant (*).

