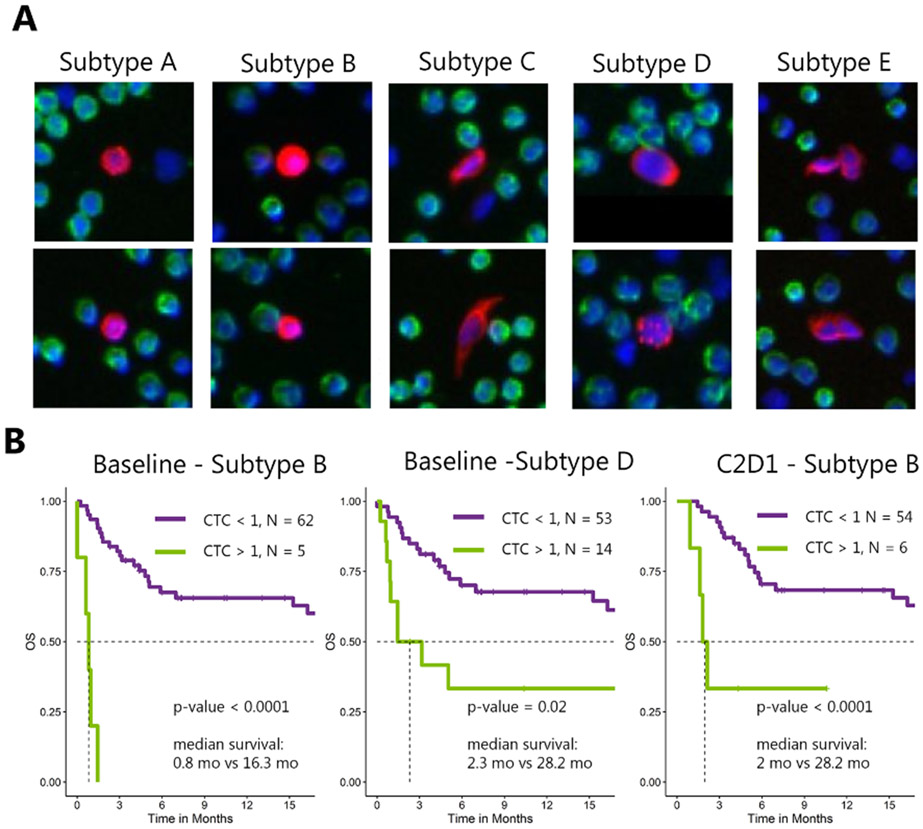
Figure 2. Morphology-based CTC subtypes and survival analysis.
A) Unsupervised clustering using digital pathology features clustered CTCs into 5 subtypes (A–E) with distinct cell morphology (see Methods). B) Kaplan-Meier curves at baseline and C2D1 with CTC subtypes using a cutoff of 1 cell detected in one mL of blood.

