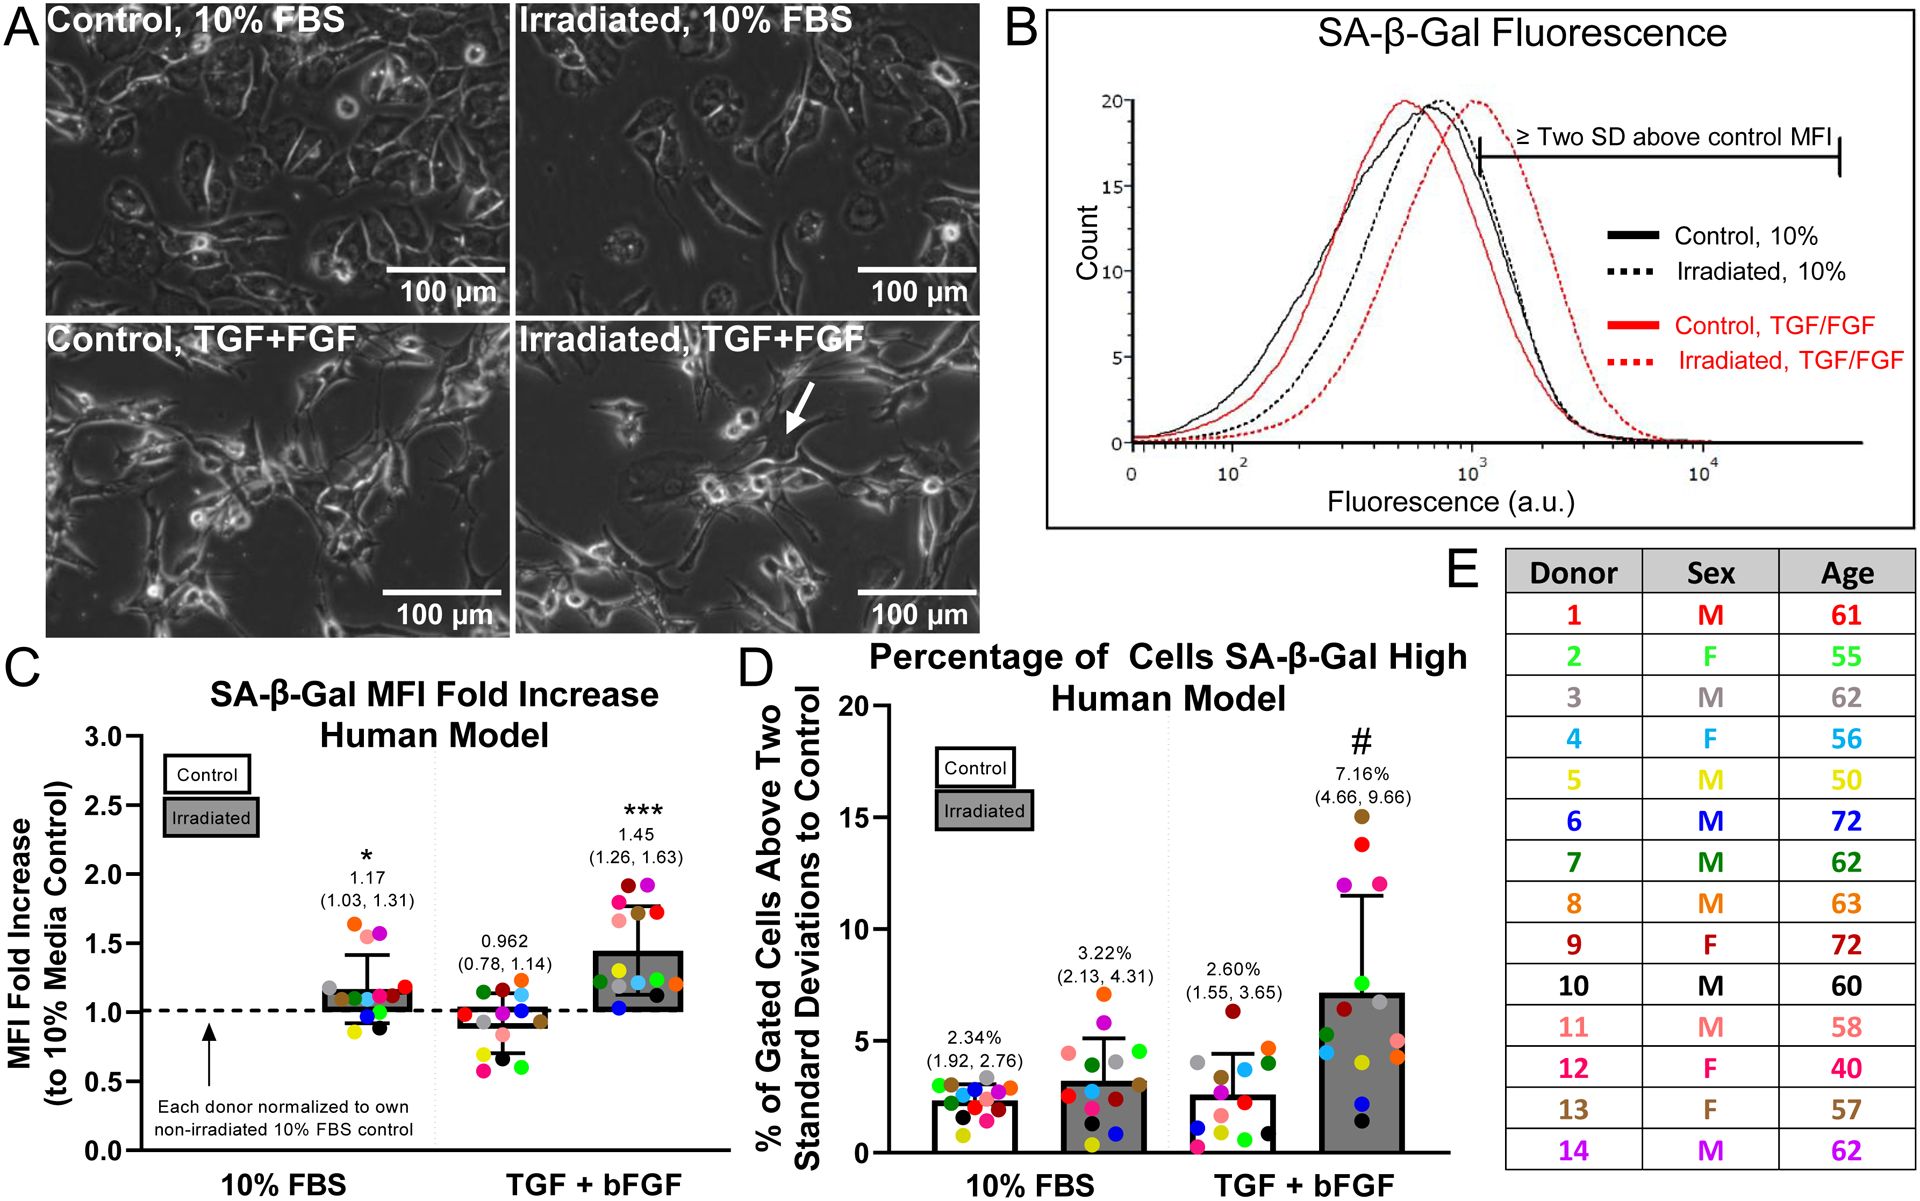
Figure 3. Quantification of senescence induction within human explants.

Human explants were divided into control and irradiated groups, cultured in explant form for 7 days, then cultured in monolayer for an additional 12 days in 10% FBS for maturation of senescence phenotype. Growth factors, 1 ng/mL TGF-β1 and 5 ng/mL bFGF, were added to the 10% FBS in the explant culture to provide a mitogenic stimulus. (A) Morphology of chondrocytes digested from control or irradiated cartilage (treated with or without growth factors) after 12 days of monolayer culture in 10% FBS medium (Human Donor 14); scale bar = 100 μm; arrow indicates bi-nucleated cell. (B) Representative SA-β-Gal flow cytometry plot with the region two standard deviations above control MFI marked (Human Donor 1). (C) SA-β-Gal MFI fold increase above the control 10% condition quantified; (*) indicates significance by one-sample t-test compared to a hypothetical value of 1, p=0.025; (***) indicates significance by one-sample t-test compared to a hypothetical value of 1, p=0.0002. (D) SA-β-Gal flow quantified as the percentage of cells SA-β-Gal high; (#) indicates significance to all other groups by 2-way ANOVA with Tukey’s multiple comparison test, p<0.005. (E) Information from human cartilage donors included in the analysis (n=14); three donors excluded due to too few cells (<800 events) in SA-β gal flow cytometry experiment and one outlier identified by Grubbs test and removed from subsequent analysis.
