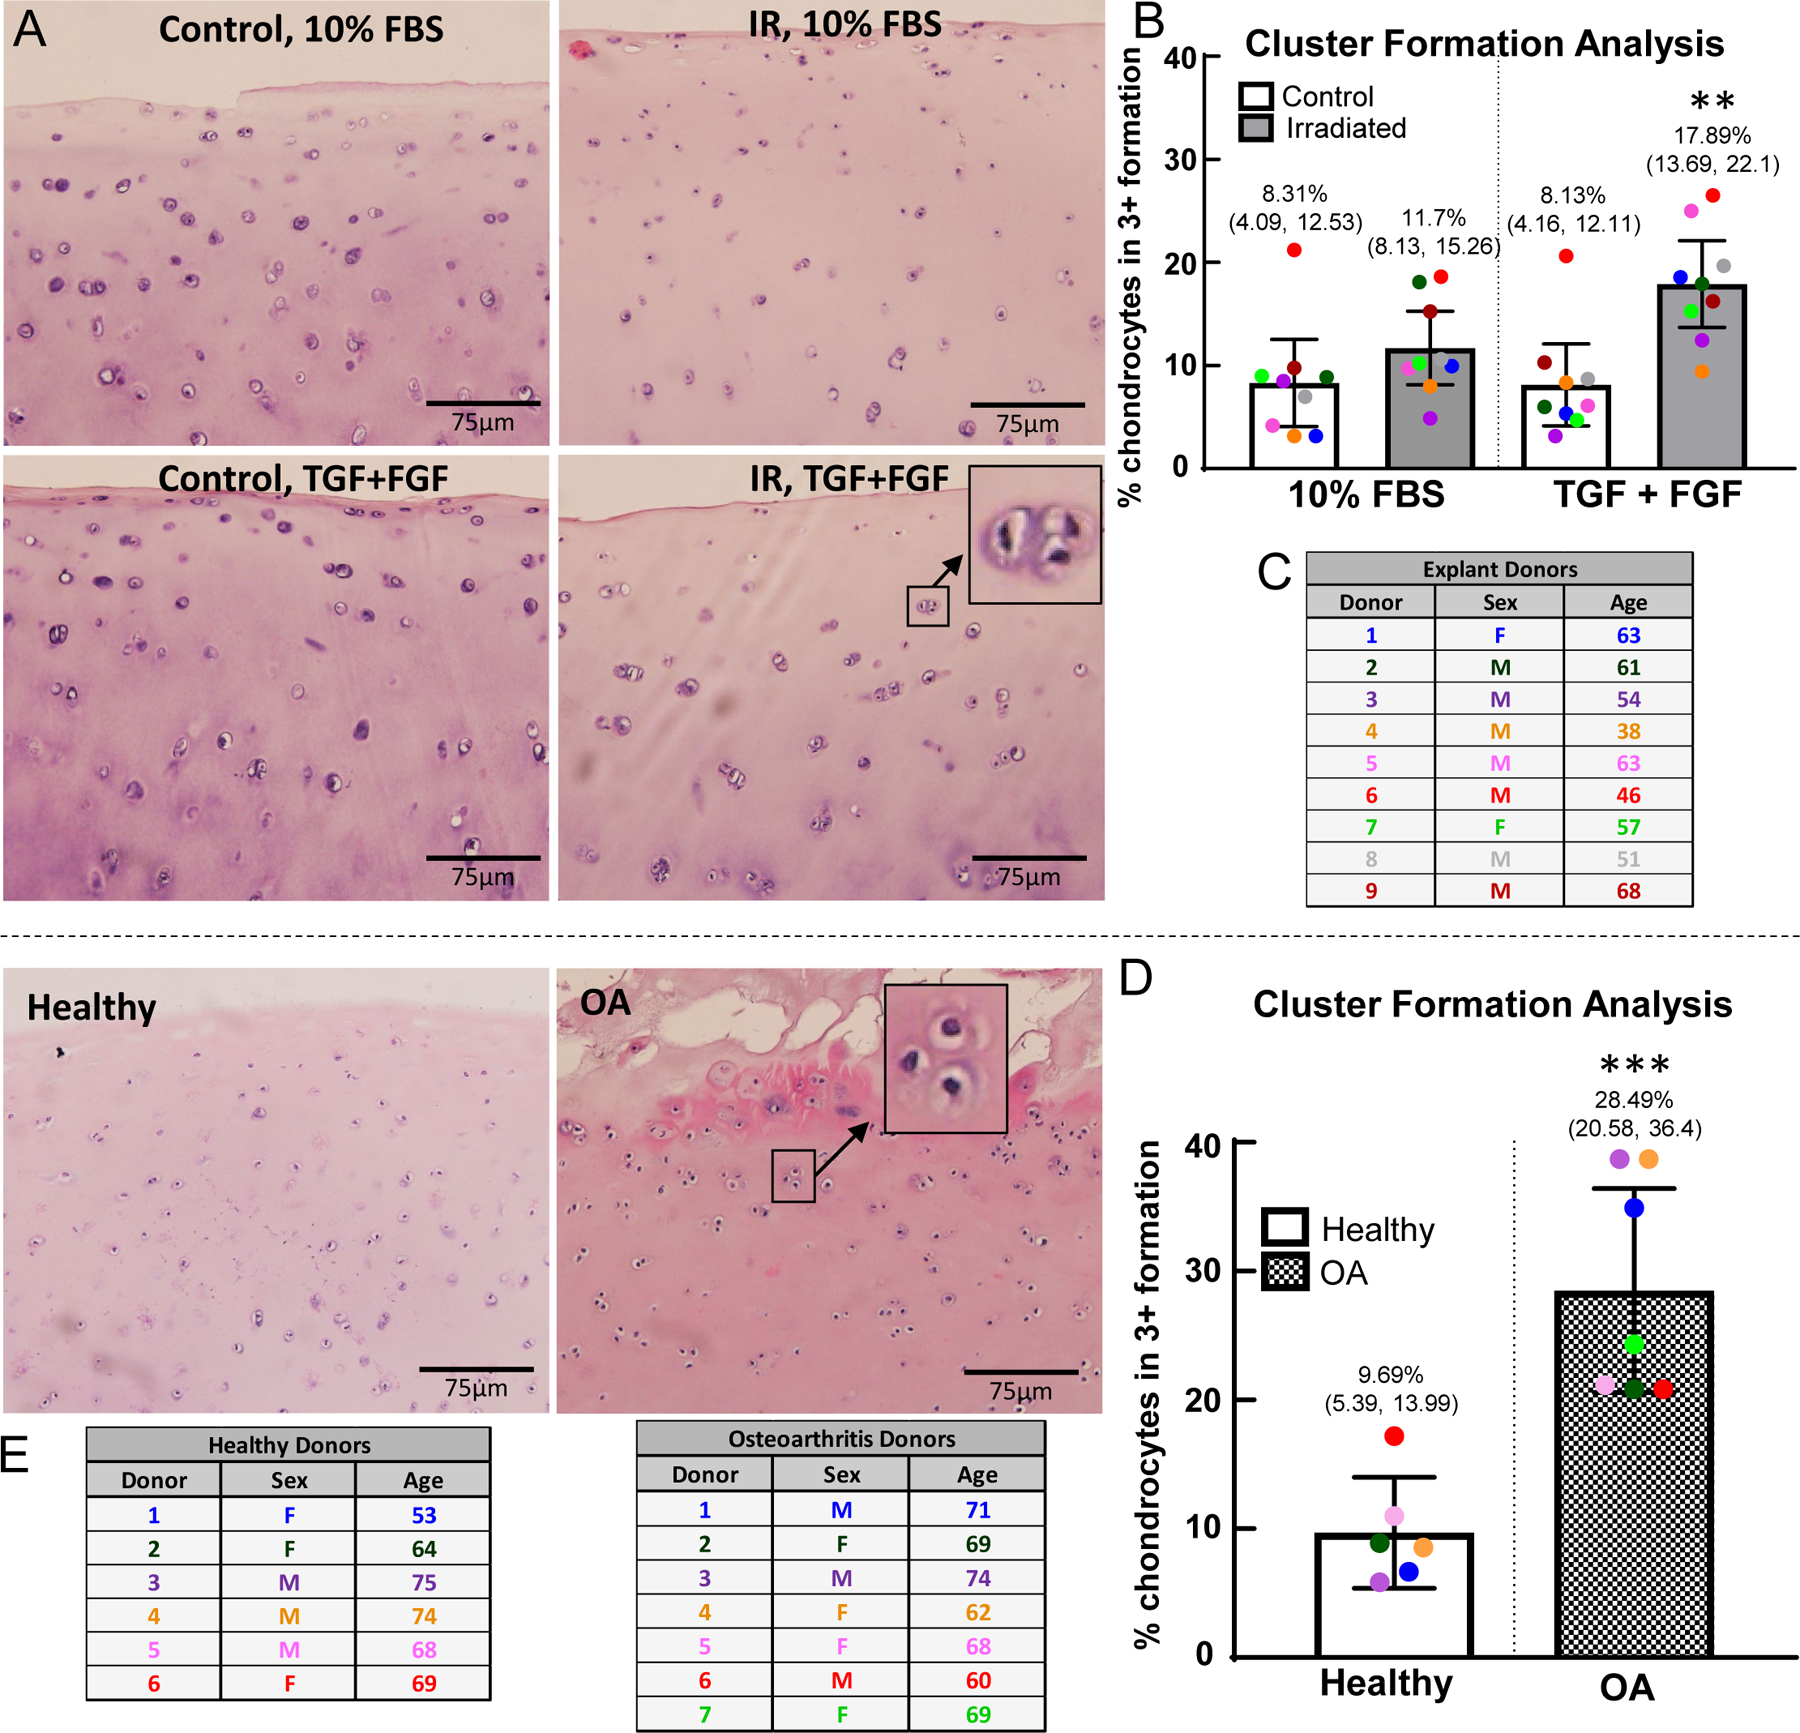
Figure 5. Chondrocyte clusters in cartilage explants.

The chondrocyte clusters in the superficial and middle zones for the control and experimental conditions were analyzed using ImageJ. (A) H&E staining on control and irradiated explants after explant culture for 7 days, with or without growth factors (Explant Donor 7). H&E staining of healthy and osteoarthritic cartilage (Healthy Donor 4, OA Donor 7). (B) Cell cluster analysis on cultured explants, with percentage of all clusters (including individual cells as a cluster) in triplet+ formation; (**) indicates significance by 2-way ANOVA with Tukey’s multiple comparison test to all other groups, p<0.01 (C) Table of the human cartilage donors included in the analysis, (n=9). One outlier identified by Grubb’s test and removed from analysis. (D) Cell cluster analysis on healthy and OA cartilage; (***) indicates significance by unpaired t-test, p=0.0006 (E) Table of the human osteoarthritis cartilage donors and healthy cartilage donors included in the analysis (n=6 healthy donors, n=7 OA donors). Average age of healthy donors is 67.2 years (3 males, 3 females); average age of OA donors is 67.6 years (3 males, 4 females). No outliers removed from analysis.
