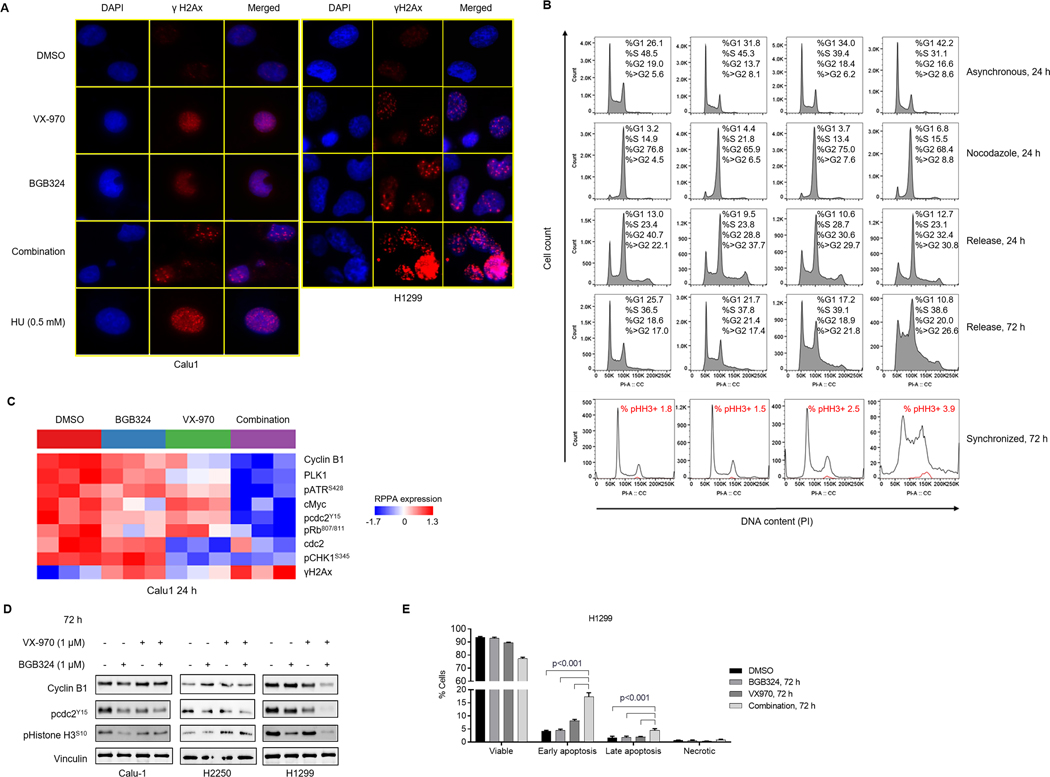
Figure 5. Combined inhibition of AXL and AXL increases γH2Ax foci and induces markers of mitotic catastrophe, resulting in S/G2-M arrest and apoptosis.
A. Immunofluorescence analysis in Calu-1 and H1299 cells treated as indicated for 24 h. Representative images of 2 independent experiments show γH2Ax (Red) and DAPI (Blue) staining. B. Calu-1 cells were treated with DMSO, BGB324, VX-970 or the combination for 24 h with and without nocodazole (200 ng/mL) followed by washout. Cells were harvested at indicated times and fixed for PI staining. Representative profiles from two independent experiments are shown. Comparison of DNA content (propidium iodide staining) in all single cells (Black) and phospho Histone H3 positive cells (Red), following treatment of Calu-1 cells synchronized with nocodazole (100 ng/mL) for 24 h followed by treatments as indicated. Percentage of total γH2Ax-positive cells indicated. C. Heatmap shows expression of proteins, determined by RPPA following 24 h treatment of Calu-1 cells with DMSO, BGB324, VX-970 or their combination (1μM), significantly altered by ANOVA comparison at FDR=0.01 cutoff. D. Western blotting analysis of Calu-1, H2250 and H1299 cells treated as indicated for 72 h shows inactivation of G2/M checkpoint (phospho cdc2) and increase in mitotic progression (phospho Histone H3). Vinculin was used as loading control. Representative images of at least 2 independent experiments are shown. E. Induction of apoptosis in H1299 cells by 72 h treatment with BGB324/VX-970 combination, assessed by flow cytometric analysis of Annexin-V FITC staining.

