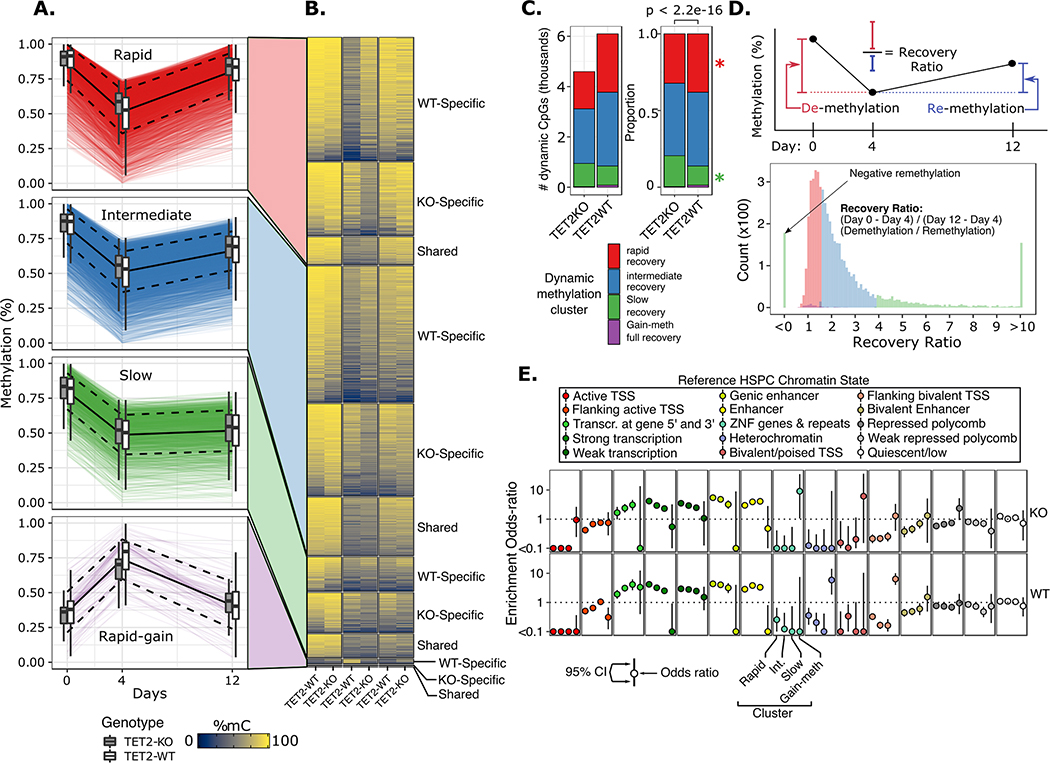
Figure 3. Hierarchical clustering of time scaled CpG methylation values resulted in four major clusters characterized by differences in remethylation rates.
A) Time profile of dynamic CpG loci for each cluster. Each colored line represents a single CpG locus; black solid line represents mean of all loci in cluster; dashed black lines represent mean +/− 1 standard deviation; boxplots show summary statistics for WT and TET2KO. B) Heatmap of dynamic CpG mean methylation values for each genotype stratified by whether the locus was a shared dynamic CpG or unique to either genotype. C) Proportion of dynamic CpGs belonging to each cluster; p value corresponds to chi-square test; * represents p-value < 0.01 for fisher’s exact test for difference in proportions of CpGs within the indicated cluster between genotypes. D) (top) schematic of the ‘recovery ratio’ which is plotted in histogram below, colored by cluster. Clusters were perfectly separated based on the recovery ratio statistic. E) Odds ratio (+/− standard error) of enrichment for dynamic CpGs within regulatory chromatin states defined in a reference normal CD34+ HSPC epigenome (Roadmap Epigenomics, E051).

