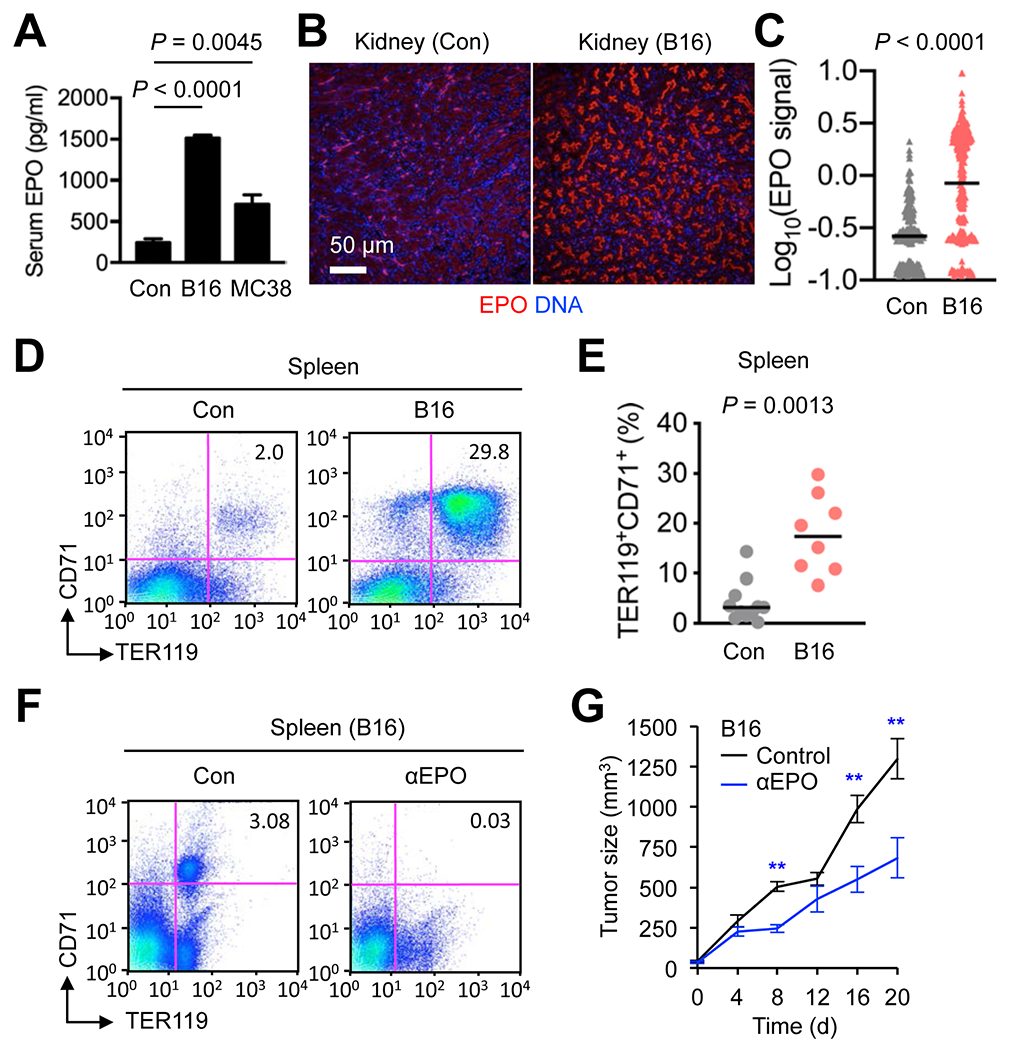
Figure 4. Tumor growth results in expansion of splenic erythroid cell populations in mice.

(A-E) Peripheral blood and tissues were prepared from mice bearing subcutaneous B16 and MC38 tumors of 1,000-2,500 mm3 in size and control (Con) mice without tumor growth. Serum EPO concentrations (n = 5, 3, and 7 for Con, B16 and MC38 mice, respectively) were determined by ELISA (A). Kidney sections were analyzed by immunofluorescence and DNA counterstaining (B). EPO immunofluorescence signals in individual EPO+ objects were quantified and shown as mean signal intensities (C). Splenocytes were analyzed by antibody staining and flow cytometry (D). Splenic CD71+TER119+ cell percentages in individual mice (circle) and their medians (line) are shown (E). Data are representative of three experiments.(F and G) B16 cells were injected into C57BL/6 mice (n = 6-8) to form subcutaneous tumors. An anti-EPO antibody and isotype-matched control (Con) immunoglobulin were administered to mice (every other day, three times in total, and the first dose given when tumor size reached 100 mm3). Splenocytes prepared from these mice were analyzed by antibody staining and flow cytometry (F). Tumor size was measured at the indicated time points (G). d, day. **, P < 0.01. Data are representative of two experiments.
