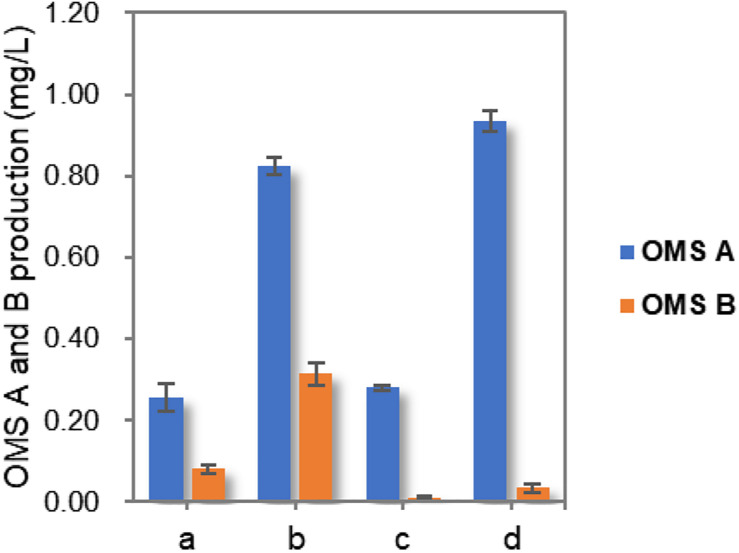
FIGURE 4.
Comparison of OMS A and OMS B production in wild-type and Mut3 strains under initial condition as well as optimized culture conditions. a, wild-type strain cultured in initial conditions; b, wild-type strain cultured in optimized conditions; c, Mut3 strain cultured in the initial conditions; d, Mut3 strain cultured in optimized conditions.

