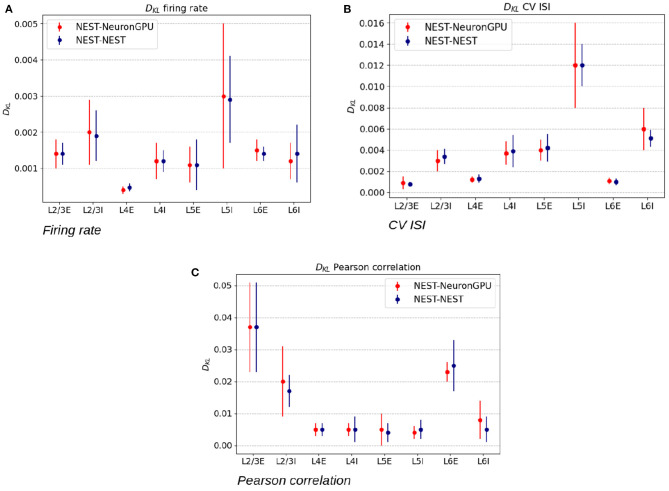
Figure 6.
Kullback-Leibler divergence between the distributions of the firing rate (A), coefficient of variation of interspike intervals (B), and Pearson correlation coefficient (C), extracted from NEST and NeuronGPU simulations. The red error bars represent the average values and the standard deviations of the divergence between NEST and NeuronGPU, while the blue ones represent the same values for NEST simulations with different seeds.

