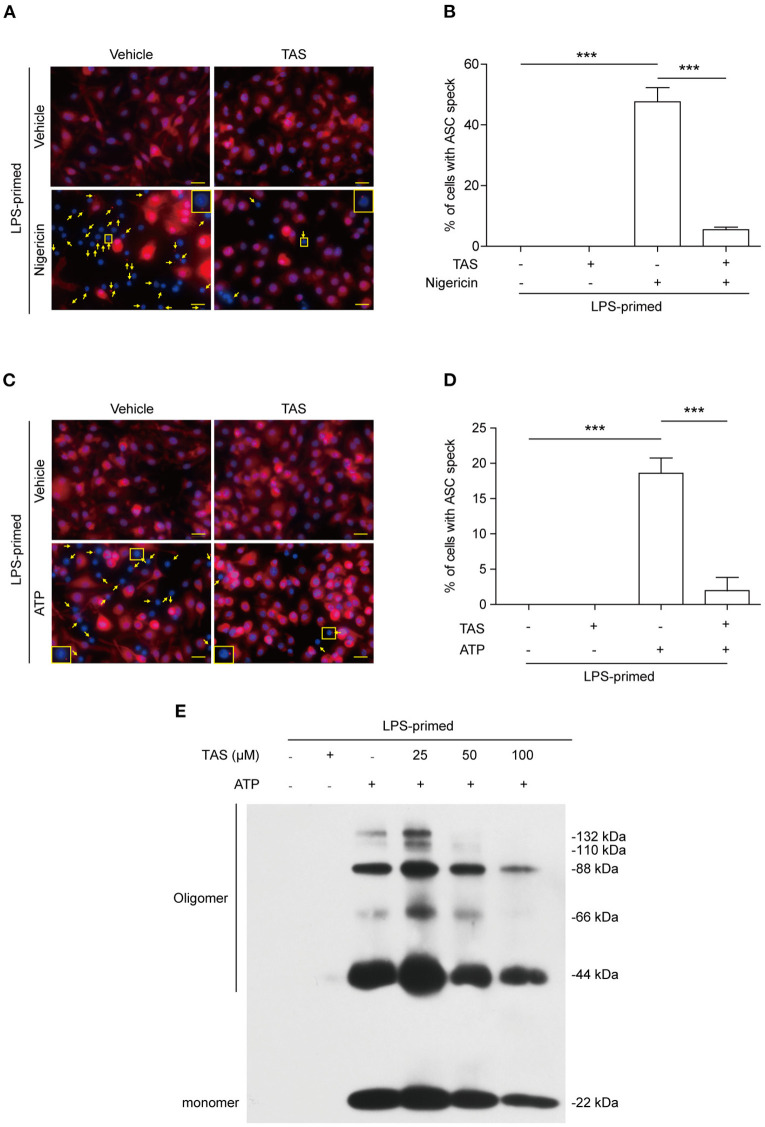
Figure 2.
TAS inhibited ASC speck formation in macrophages. BMDMs were primed with LPS (0.5 μg/ml) for 4 h and then pretreated with TAS (100 μM) for 1 h, followed by stimulation with nigericin (3 μM) for 1 h (A,B) or ATP (2 mM) for 30 min (C,D). (A,C) Representative immunofluorescence images showing ASC (red) subcellular distribution. Nuclei were stained with Hoechst 33342 (blue). The images for ASC and nuclei were captured, respectively, and merged together. Yellow arrows indicate ASC specks and the insets show the cell with an ASC speck. (B,D) Histograms show the percentage of cells with an ASC speck relative to total cells from 5 randomly chosen fields. Data are shown as mean ± SD (n = 5). ***P < 0.001; ns, not significant; scale bars, 20 μm. ASC oligomerization after ATP stimulation was assayed by Western blotting (E).

