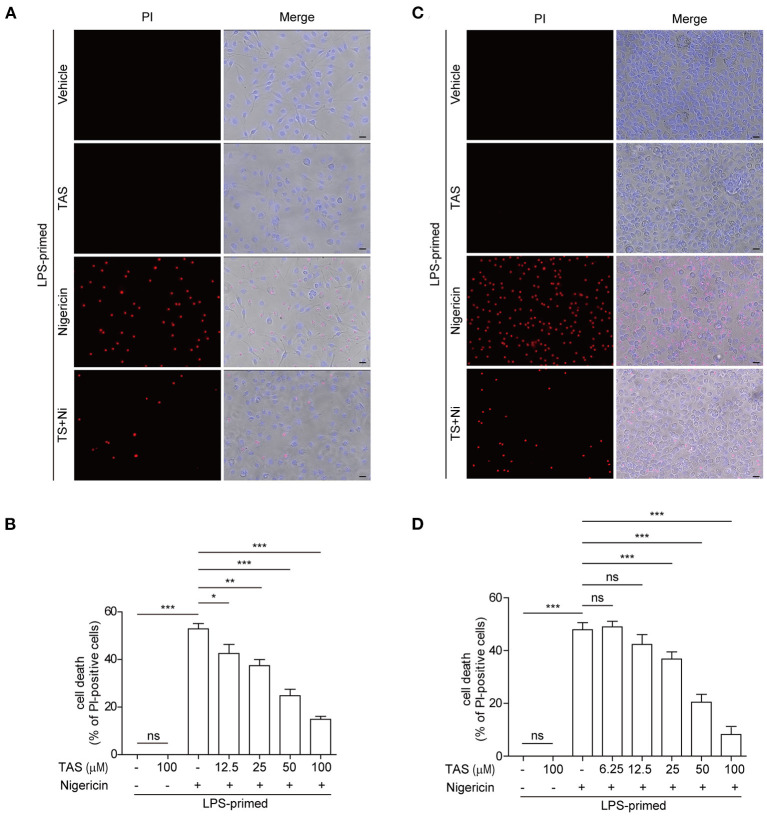
Figure 3.
TAS dose-dependently suppressed nigericin-induced pyroptosis in macrophages. BMDMs (A,B) were treated as in Figure 1A and TGPMs (C,D) were treated as in Figure 1E. (A,C) After TAS and nigericin (Ni) treatment, BMDMs and TGPMs were stained with 2 μg/ml propidium iodide (PI) (red; staining dead cells) and 5 μg/ml Hoechst 33342 (blue; staining all cells) for 10 min, and then observed by fluorescent microscopy. Bright-field images are also shown in merged ones (here images of TAS = 100 μM are shown). (B,D) The percentage of cell death is defined as PI-positive cells to all cells (Hoechst 33342-positive) in 5 random fields. Data are shown as mean ± SD (n = 5). *P < 0.05; **P < 0.01; ***P < 0.001; ns, not significant; scale bars, 20 μm.

