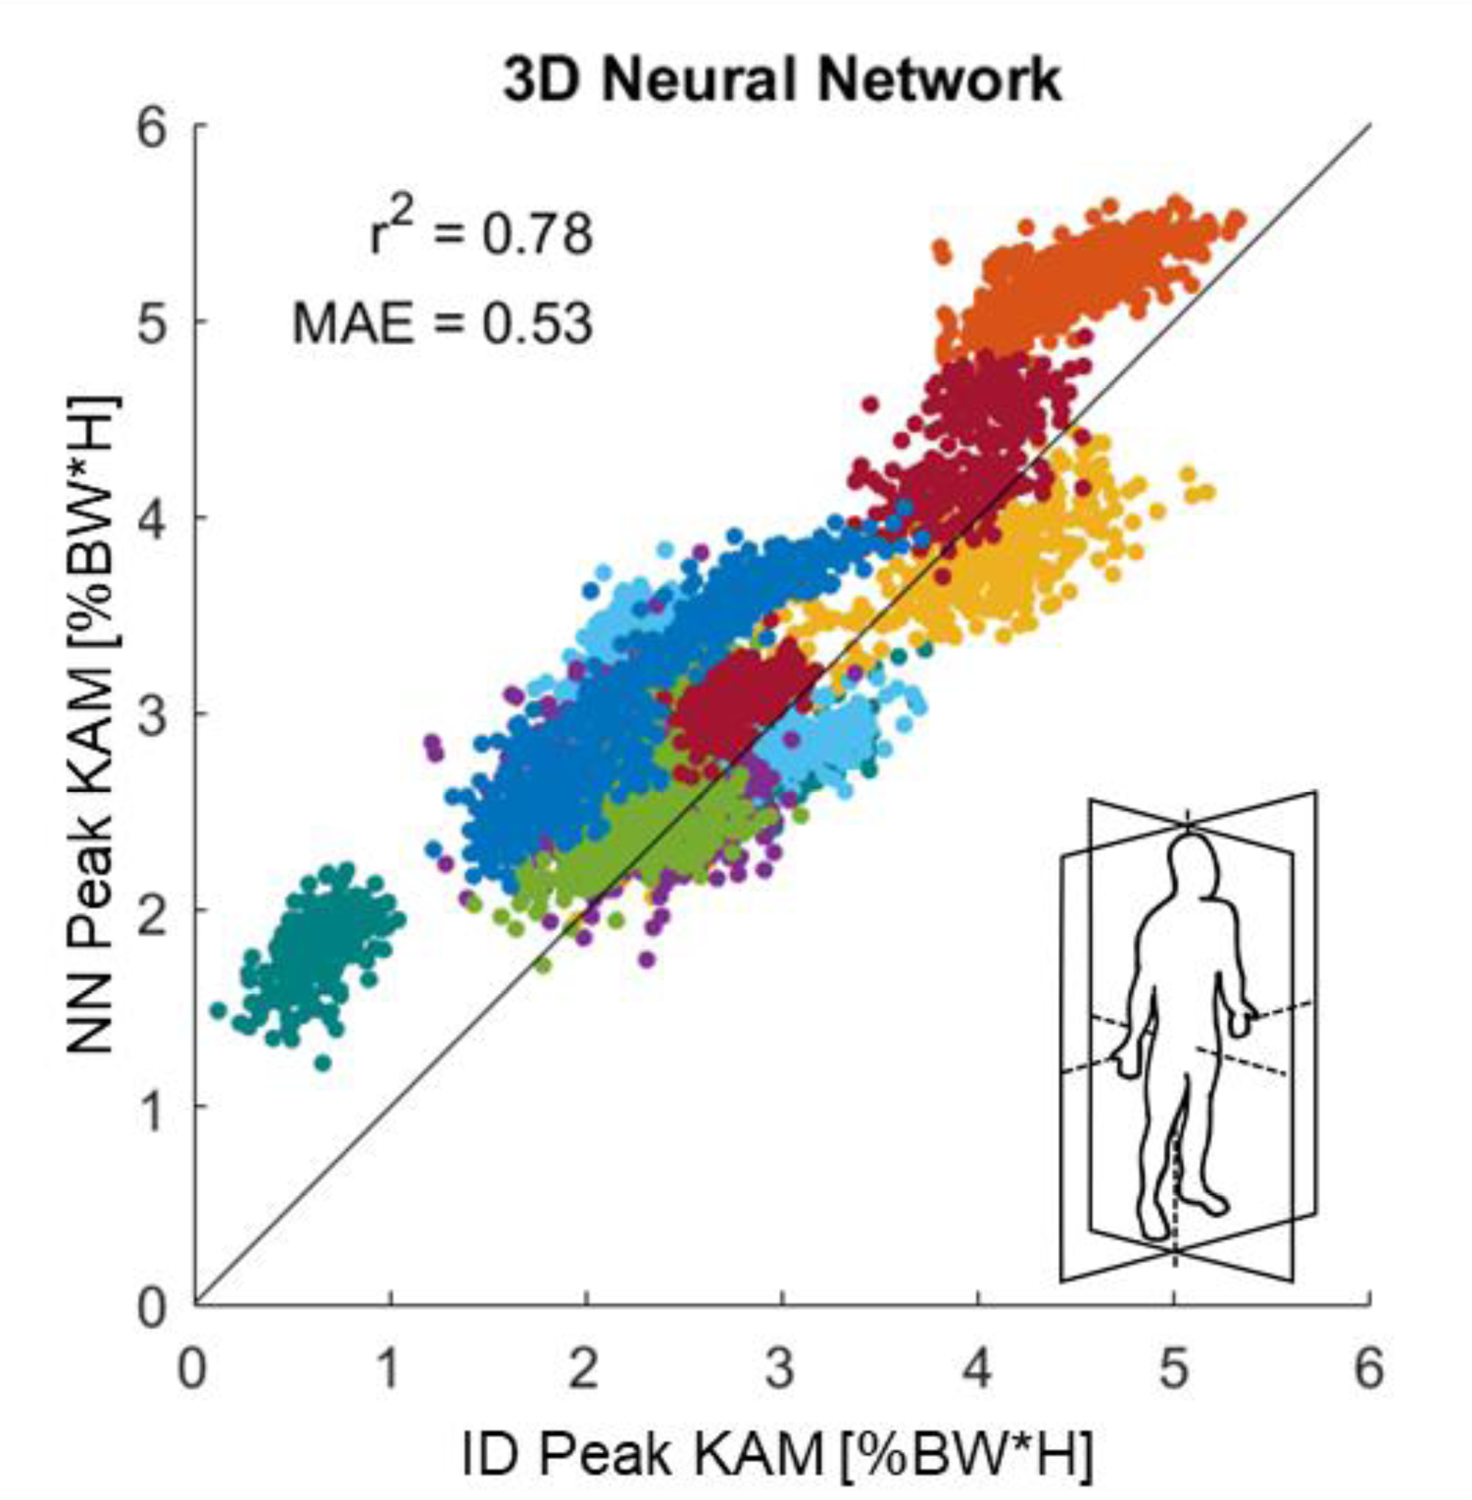
Figure 2.

The predicted peak knee adduction moment (KAM) from the neural network (NN) using 3D anatomical landmark positions as input (3D neural network) vs. the peak KAM calculated from inverse dynamics (ID) plotted against the y=x line. Presented data are for test subjects from the baseline and foot progression angle modification trials. Each point represents a single step, and a single color represents the steps from both legs of a subject.
