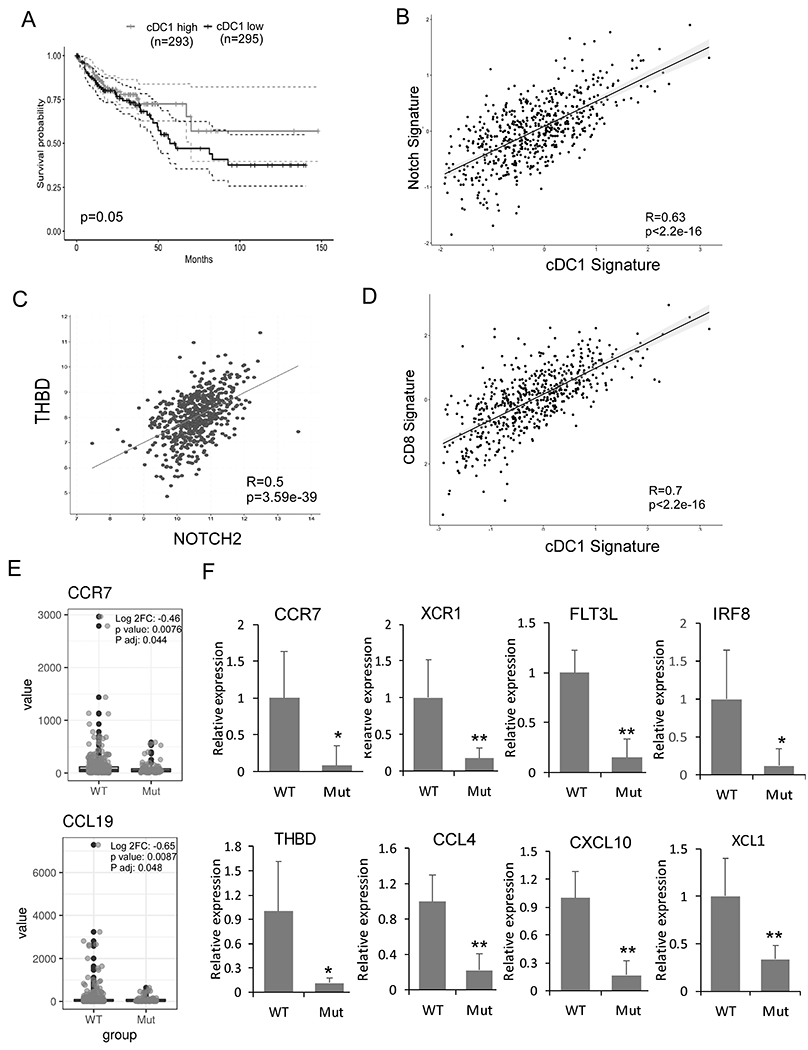
Fig 5. Association between Notch signaling and cDC1 signature genes and altered cDC1 gene expression in human GMDS mutant CRCs.

The following data analysis was performed on TCGA data base. (A) Prognostic value of the cDC1 signature (CCR7, XCR1, FLT3, CLEC9A, and THBD) for overall survival of human CRC patients comparing top and bottom quartiles. (B-D) Scatterplots showing correlation analyses of the cDC1 gene expression signature (BATF3, FLT3, CLEC9A, XCR1, and THBD) with the Notch gene expression signature (NOTCH2, DLL1) (B); of NOTCH2 and THBD (C); and the cDC1 gene expression signature (BATF3, FLT3, CLEC9A, XCR1, and THBD) with a CD8+ T-cell signature (CD8A and CD3E) (D). Spearman correlation coefficient and p values are shown. (E) CRCs from TCGA were stratified based on GMDS mutation. GSEA was performed using DC genes CCR7 and CCL19. (F) mRNA expression in archived tissues from GMDS WT (n=9) and GMDS mutant CRC (n=7) by qRT-PCR and normalized to the expression in GMDS WT CRC. Results shown are mean ± SD. Student t-test was performed; *p<0.05, **p<0.01
