Fig. 3.

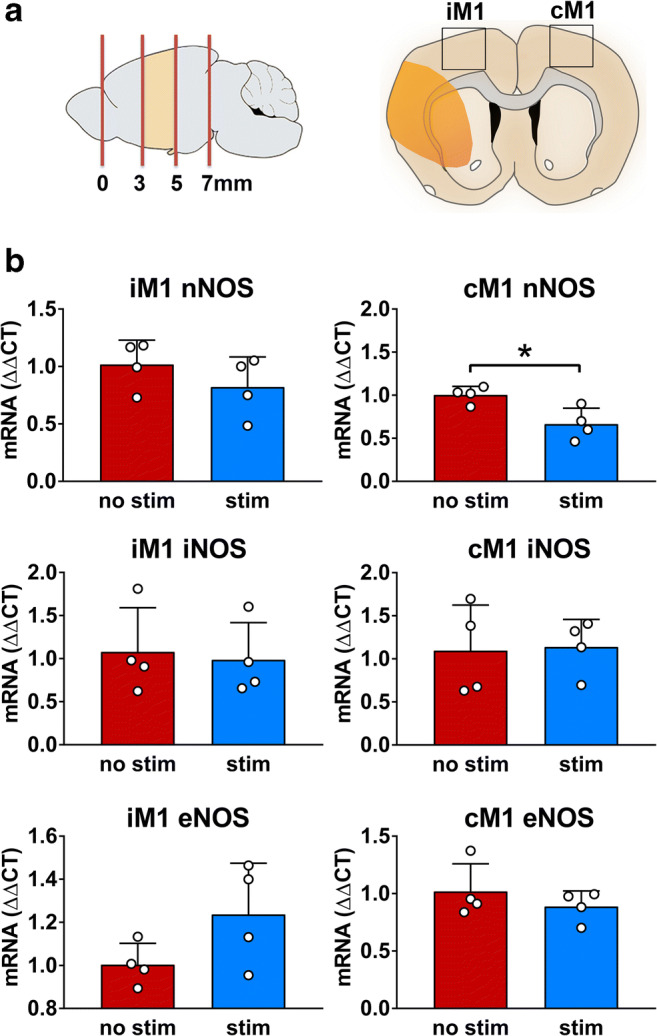
nNOS mRNA is selectively decreased in cM1 after optogenetic stimulation of the cLCN. a Schematic depicting the location of iM1 and cM1 within tissue sections selected for RNA and protein analysis. mRNA expression of NOS isoforms (nNOS, iNOS, eNOS) was quantified in iM1 and cM1 of cLCN-stimulated and non-stimulated mice at post-stroke day 15. b Bar graphs with scatter dot plot shows nNOS mRNA expression was significantly decreased in cM1 of cLCN-stimulated animals. Data are expressed as mean ± SD. There was no significant difference in nNOS mRNA expression in iM1 between stimulated and non-stimulated mice. Similarly, there were no differences in iNOS or eNOS between groups in iM1 or cM1. n = 4 for each group. *P < 0.05, significant difference between stimulated and non-stimulated stroke mice, one-way ANOVA with Fisher’s LSD
