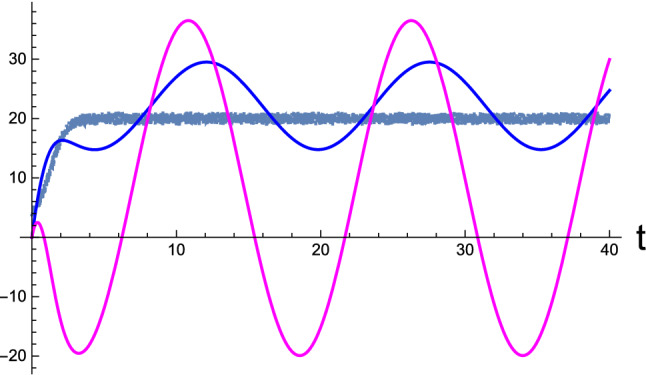
Fig. 3.

Active perception: Time-development of the perceptual state inferring the external causes of sensory inputs altered by the agent’s motor control. Blue and magenta curves depict the brain activity and corresponding momentum p(t), respectively. In addition, the noisy curve indicates the nonstationary sensory inputs entering the sensory receptor at instant t. For numerical illustration, we used . [All curves are in arbitrary units.]
