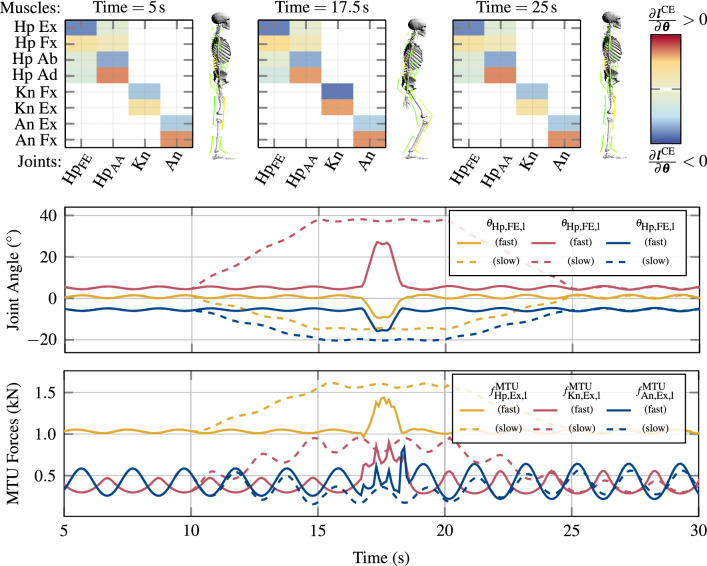
Fig. 8.
Simulation results of the fast (, solid lines) and slow (, dashed lines) squat movements according to the simulation task formulated in Sect. 3.5. The joint angles (upper line-plot) mostly follow their nominal trajectories (45–47) to execute the squat. The MTU forces of the Hp, Fx, and Kn Fx MTUs increase during the squat, while the An and Fx MTU force slightly decreases. This may be explained by the facts that the Hp and Kn joints swing further away from their unstable upright equilibria and the overall distance in z-direction of the body’s COM to the An joint decreases. In the box-plots, excerpts of the angle–length Jacobian matrix (18) for the left leg for the time instances , and are displayed as heat-maps of MTU contribution to Fx and Ex movements

