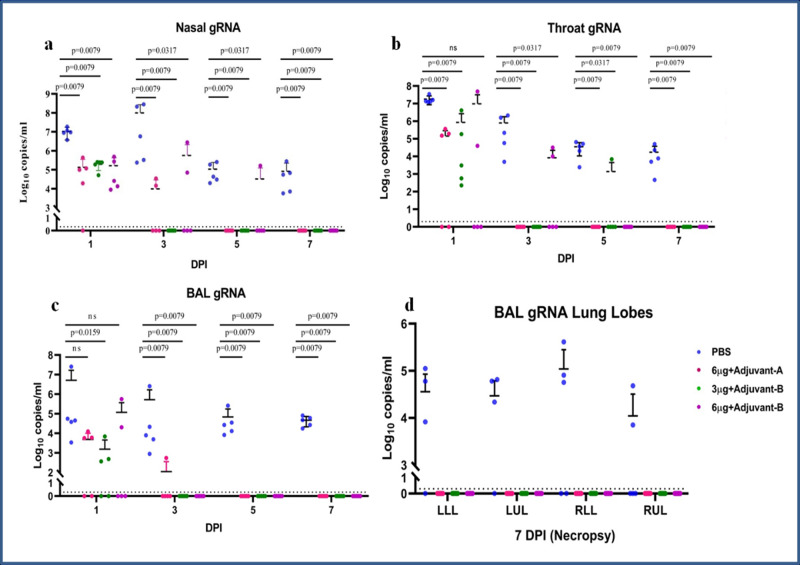
Fig. 3. Genomic viral RNA detection in respiratory tract specimens.
Genomic viral RNA load in (a) nasal swab, (b) throat swab and (c) BAL at 1, 3, 5 and 7 DPI. d Genomic viral RNA load in different lobes of lungs at 7 DPI. The statistical significance was assessed using the Kruskal–Wallis test followed by the two-tailed Mann–Whitney test between the two groups; P values < 0.05 were considered to be statistically significant. The dotted lines indicate the limit of detection of the assay. Data are presented as mean values +/− standard deviation (SD). Statistical comparison was done by comparing the vaccinated group with the placebo group as a control. Group I = blue, group II = pink, group III = green and group IV = purple, number of animals = 5 animals in each group. Source data are provided as a Source Data file.

