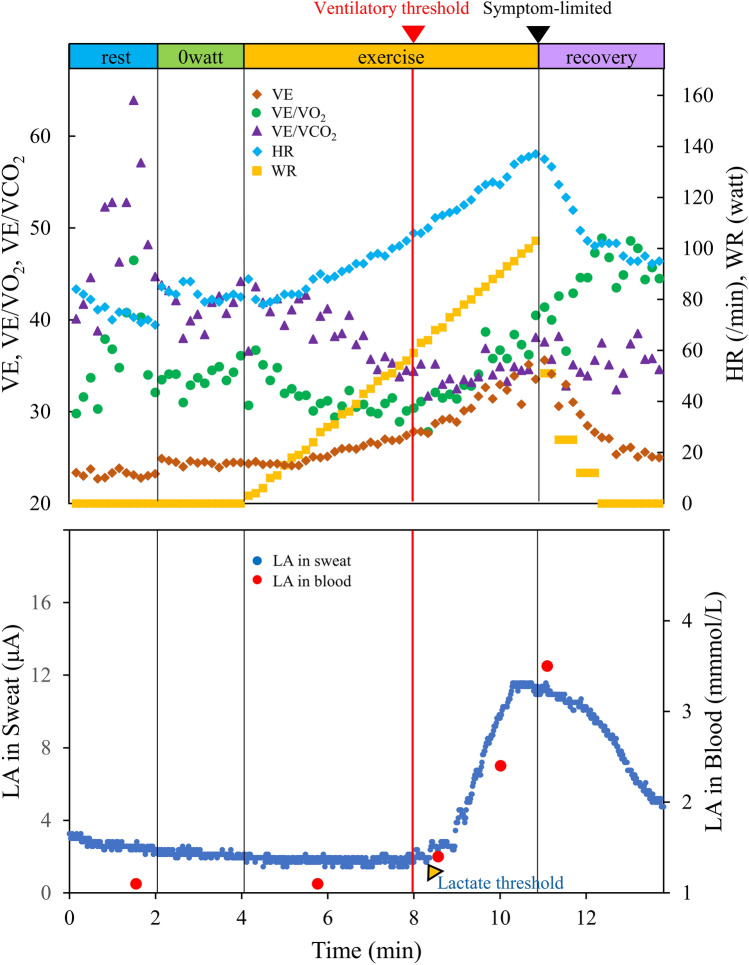
Figure 2.
Imaging of the lactate in the sweat during incremental exercise. Representative graphs (dots) of the lactate in sweat (LA in sweat; dark blue) and lactate in blood (LA in blood; red) during exercise with a RAMP (15 W/min) protocol ergometer are shown in the lower panel. The respiratory gas data was shown in the upper panel. HR heart rate, LA lactate, VE ventilatory equivalent, VE/VCO2 ventilation-carbon dioxide production, VE/VO2 ventilation-oxygen uptake, WR work rate.

