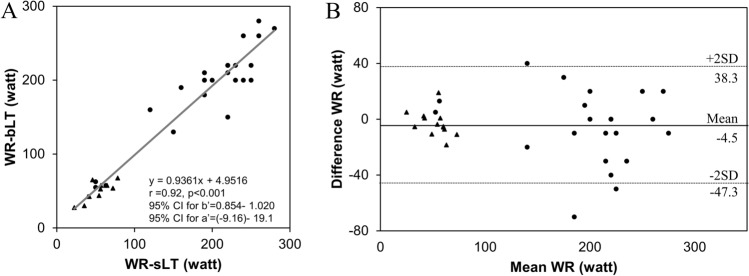
Figure 3.
Validity testing of the WR at the sLT and bLT. (A) The graph shows the relationship between the work rate (WR) at the sLT and bLT. (B) The graph shows the Bland–Altman plots, which indicate the respective differences between WR at the sLT, and bLT (y-axis) for each individual against the mean of the WR at the sLT, and bLT (x-axis). Triangles indicate the data of patients and circles indicate the data of healthy subjects. r correlation coefficient, 95% CI for b’ 95% confidence interval for the slope, 95% CI for a’ 95% confidence interval for y-intercept, SD standard deviation.

