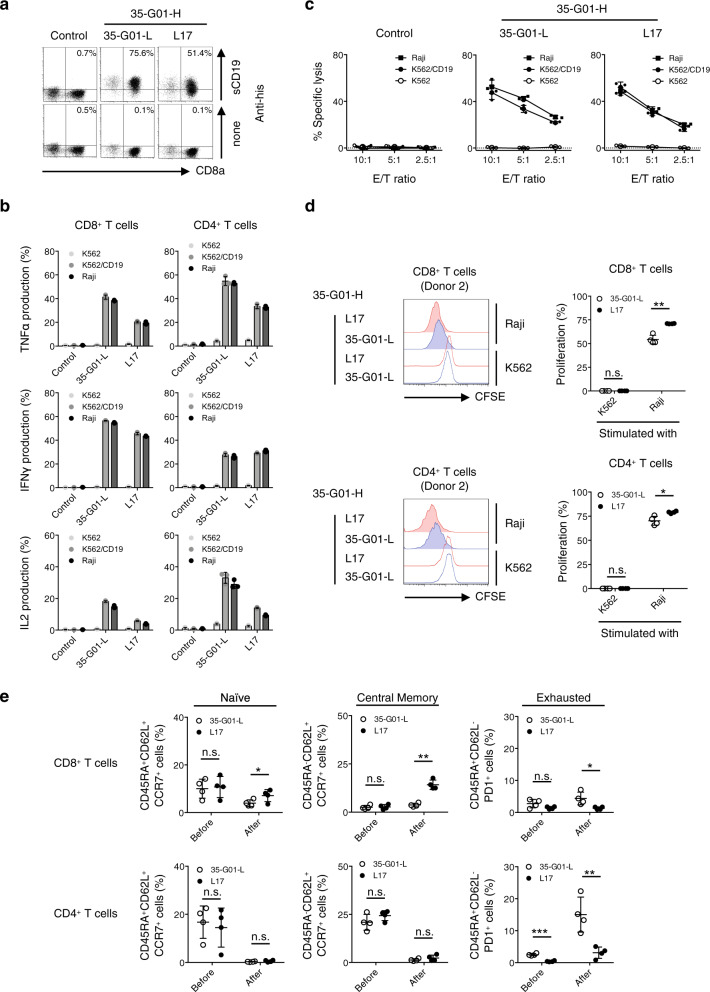
Fig. 5. Antitumor reactivity, proliferation capacity, and durable phenotypes of scFv-optimized CD19 CAR-T cells.
a, b Clone L17, or the original 35-G01-L CD19-specific second generation (CD28ζ) CAR was transduced into peripheral blood T cells, which were then stained with 40 μg/mL sCD19 dimer or PE-anti-his mAb alone, and representative dot plots are shown. Each percentage of sCD19 dimer-positive cells in ΔNGFR+ cells is displayed (a). L17, and 35-G01-L CD19 CAR-T cells were incubated with the indicated target cells, and their cytokine production was measured by intracellular cytokine assays. The experiments were performed in triplicate, and error bars show the SD (b). Control T cells were prepared by transduction of the ΔNGFR gene into human peripheral blood T cells. Gene-modified T cells with similar transduction efficiency were obtained, and then ΔNGFR-positive cells were gated and analyzed. c The cytotoxicity of established and isolated CD19 CAR-T cells against target cells was examined by 51Cr-release assays. The experiments were performed in triplicate, and error bars depict the SD. d, e L17, and 35-G01-L CAR-T cells established from four different donors were isolated, labeled with carboxyfluorescein diacetate succinimidyl ester (CFSE), and stimulated with irradiated Raji cells at an E/T ratio of 1:1. After 3 days of incubation, the mean fluorescence intensity (MFI) of CFSE-labeled CAR CD8+ T cells and CD4+ T cells was examined. The MFI values for each of the donor-derived CFSE-labeled CAR-T cells in the presence of K562 cells instead of Raji cells were utilized as a control. Histograms for CFSE-CAR CD8+ T cells and CD4+ T cells (donor 2) stimulated with Raji cells (filled lines), or K562 cells (dotted lines), are shown. Red represents the histograms of L17 CAR-T cells, and blue those of 35-G01-L CAR-T cells (left). The percentage of proliferation was calculated as: (control MFI−experimental MFI)/(control MFI) × 100 (%), and is summarized (right) (d). CD45RA+CD62L+CCR7+, CD45RA-CD62L+CCR7+, and CD45RA+CD62L-PD1+ populations among individual CAR CD8+ T cells and CD4+ T cells before and after stimulation with Raji cells are also summarized (e). Each dot depicts the percentage of the indicated population among CAR-T cells generated from each donor. Differences between L17 and 35-G01-L CAR-T cells were statistically assessed by paired t test (two-sided). *p < 0.05; **p < 0.01; ***p < 0.001; n.s., not significant.

