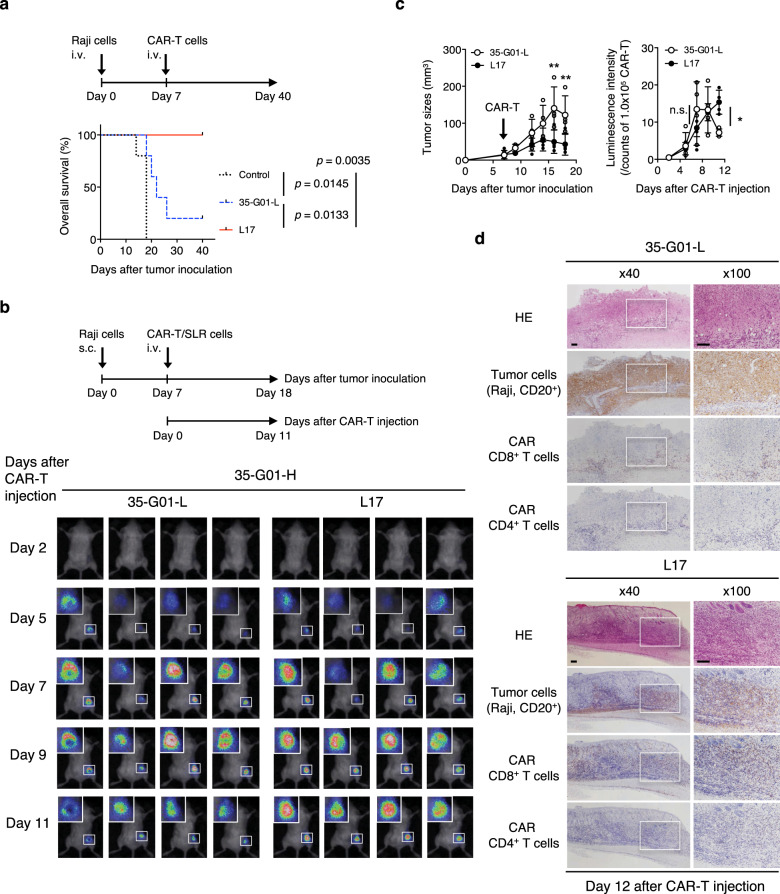
Fig. 6. Superior in vivo antitumor functions mediated by scFv-optimized CD19 CAR-T cells.
a Five hundred thousand Raji cells were intravenously injected into irradiated NOD/Shi-scid IL2rgamma(null) mice. After engraftment of the Raji cells, 2.0 × 10⁶ L17, 35-G01-L CAR-T cells, or control T cells generated from the same donor were intravenously injected on Day 7. Overall survival of the mice (n = 5 mice per group) is depicted in the form of Kaplan–Meier curves, and survival was compared among the groups. Log-rank (Mantel–Cox) test was performed, and p values are also shown. b One million Raji cells were subcutaneously inoculated into irradiated NOD/Shi-scid IL2rgamma(null) mice, then 2.0 × 10⁶ L17 or 35-G01-L CAR-T cells, which can express SLR, were intravenously injected on Day 7. Photon images of mice obtained after CAR-T-cell injection are shown (n = 4 mice per group). The small white rectangles are magnified and shown in the upper left corner for each mouse. c Tumor sizes (mm3) (left) and photon counts normalized by each photon count obtained from 1.0 × 10⁵ L17 or 35-G01-L CAR-T cells (right) are shown. The arrow inside the left-hand graph indicates the time at which CAR-T cells were injected. Error bars show the SD. Two-way ANOVA with Sidak’s correction was conducted for multiple comparisons. *p < 0.05; **p < 0.01; n.s., not significant. d Mice shown in (b) were sacrificed on Day 12 after CAR-T injection, and tumor tissues isolated from the right flanks were assessed histologically. Representative immunostained sections (hematoxylin and eosin (HE); CD20 for tumor cells; CD8 and CD4 for CAR-T cells) obtained from tissues in a representative mouse from each group are shown. The white rectangles (left, ×40) are displayed as magnified images (right, ×100). The scale bars in the pictures represent 100 μm.

