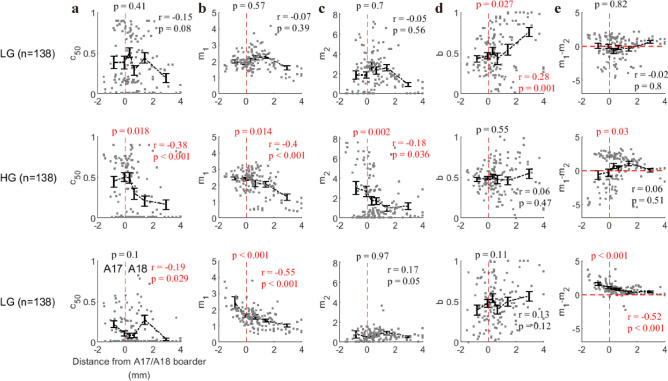
Figure 12.
The correlation between brain areas (A17 vs. A18) and fitting parameters. The distance from the border between Area 17 and Area 18 was used to represent the spatial position of the individual recording site. The A17/A18 border was determined through the previous work38. Subfigure a shows the relationship between the distance from A17/A18 border (distance index) and fitting parameter c50 for three signals (from top to bottom: low gamma, high gamma, and MUA). Subfigures (b–d) are similar to (a), but they account for the relationship between distance index and fitting parameters m1, m2, b, and m1–m2 respectively. Spearman’s correlation was used to account for correlation measurement. Note that the sites with negative distance index are located in A17, while the positive distance index means A18 (zero is marked by red dot line). The p-values (T-test) located above red dashed lines in each subplot represent the statistical significances for whether parameters in brain Area 17 are significantly different from Area 18. The data points in each subfigure were divided into six groups based on their ranking order for values of each variable. The error bar in each group denotes the mean value (black circle) and standard deviation (black bar) of normalization parameter.

