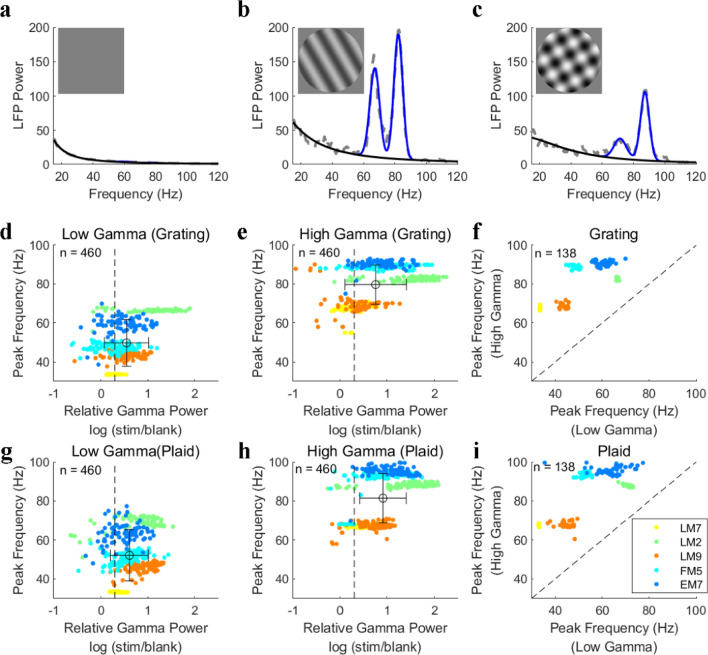
Figure 2.
Two distinct gamma oscillations are induced by drift gratings and plaids. Subfigures (a), (b) and (c) demonstrate LFP power spectrums induced by a blank condition (a), grating (b), and plaid (c) respectively. The size and spatial frequency of these stimuli were 38° and 0.05 cycle/o. In (a), (b), and (c), gray lines indicate the raw LFP spectrums. Blue curves and black curves indicate the estimated narrow-band gamma power and baseline power through the spectrum fitting procedure. (d) shows the peak frequency and relative gamma power of the low gamma oscillation (narrow-band) induced by the drifting grating for all the recording sites. The horizontal error bar represents the mean and standard deviation of the relative gamma power and the vertical error bar represents that of peak frequency. Similar to (d), (e) shows the peak frequency and relative gamma power of the high gamma oscillation (narrow-band) induced by the drifting grating for all the recording sites. (f) Presents a comparison between the peak frequency of the low gamma and high gamma oscillations for sites with all signals good (n = 138: LG, HG, and MUA). (g)–(i), the same as (d)–(f), but for gamma oscillations induced by a plaid stimulus. Note that the relative gamma power is defined as the ratio between the stimulus-driven gamma power and the baseline. The threshold (black dotted line) for selecting salient gamma oscillations is labeled in subfigures (a), (e), (g), and (h).

