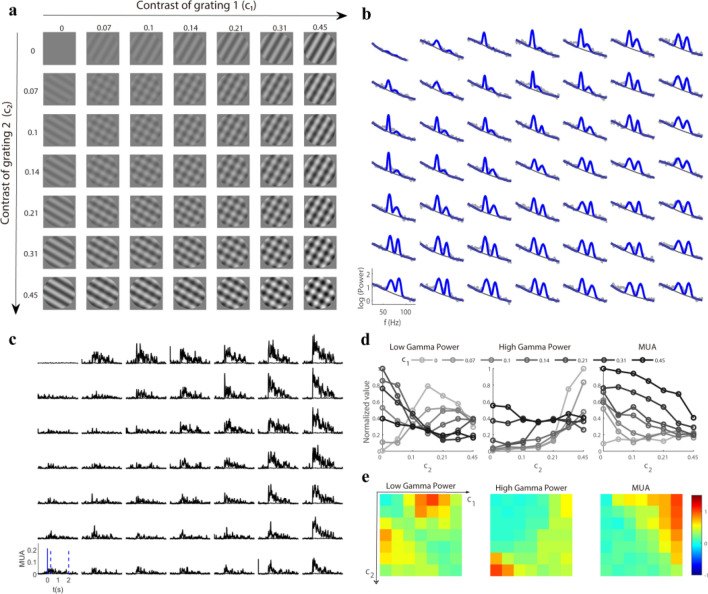
Figure 3.
Response matrix was driven by plaid for an example site. (a) presents various plaids formed by the linear summation of two orthogonal drift gratings with varying contrast. These stimuli (size, 38°; spatial frequency, 0.05 cycle/o) were presented for 2 s with a time–frequency of 2 Hz and were repeated 10 times. (b) shows the trial averaged (n = 10) LFP power spectrum (gray dots) in response to corresponding stimuli in a. Two narrow-band gamma oscillations (blue curve) and the baseline (dark gray line) were estimated through a spectrum fitting procedure. (c) shows trial averaged (n = 10) spiking activity (MUA) driven by the stimuli in (a). The appearance of stimuli is labeled by a solid blue line in (c). The time-averaged (time period marked by the two dotted lines) MUA was used for (d) and (e). (d) presents several contrast (c2) tuning curves with the contrast of grating 1 (c1) fixed for low gamma power, high gamma power, and MUA. (e) demonstrates the response matrices of low gamma power, high gamma power, and spiking activity (MUA) in response to stimuli in (a). Note that all the responses in (d) and (e) were normalized by their maximum value.

