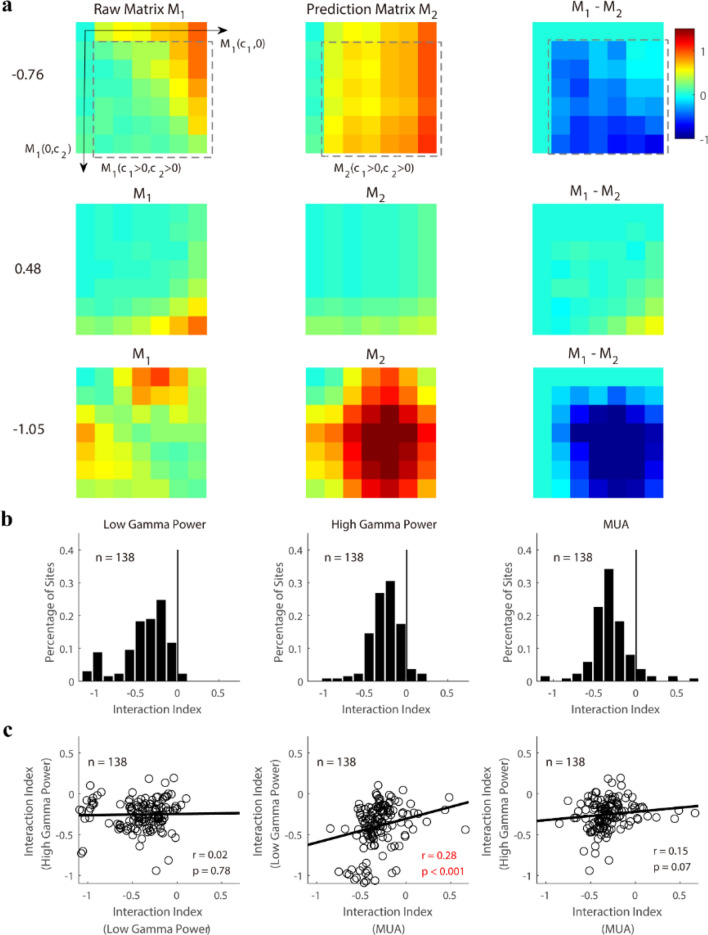
Figure 4.
The interaction indices measured from response patterns of gamma oscillations and MUA. (a) demonstrates the response matrices (M1) in response to stimuli in Fig. 3a for three example sites. The prediction matrix (M2) can be calculated as: M2(c1, c2) = M1(c1, 0) + M1(0, c2). The interaction index was then defined by the Eq. (6) in “Materials and methods”. The values of the interaction index were labeled by the side of each example. (b) shows histograms of the interaction indices for low gamma power (LG), high gamma power (HG), and MUA. The index of most sites (n = 136 for LG; n = 132 for HG; n = 128 for MUA) was significantly lower (Bootstrap method, p < 0.001) than 0 (black solid line). (c) Shows the site by site correlations of interaction indices among three signals (from left to right, they are the correlation between LG and HG, the correlation between LG and MUA, and the correlation between HG and MUA). Pearson’s correlation was used to test the significance of the relationship in each pair of comparisons (significant correlation was marked as a red font). Linear regression (black lines in c) was also calculated for correlation measurements.

