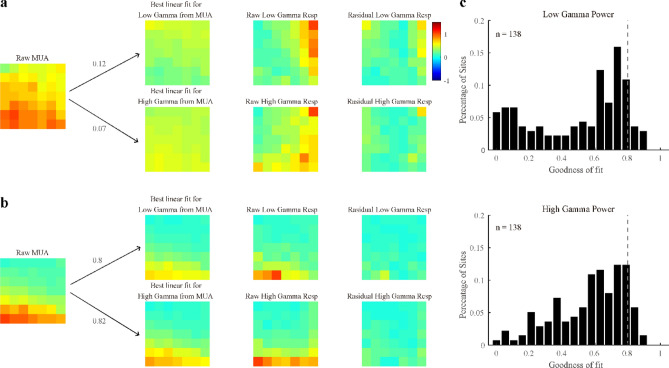
Figure 5.
Linear predictions for response patterns of gamma oscillations from those of MUA. Subfigures (a) and (b) demonstrate the linear predictions and residuals for response patterns of low and high gamma from that of MUA in two example sites. The goodness of fit of these two examples was calculated and labeled in subfigures (a) and (b). Note that subfigure a represents a poor prediction of the response pattern of gamma oscillations from that of MUA, whereas subfigure b demonstrates a good one. Using the same method, the population goodness of fit of the linear prediction of the response pattern of low gamma (top) and high gamma power (bottom) is presented in (c). Note that the goodness of fit threshold (gray dotted line) is labeled in the histogram.

