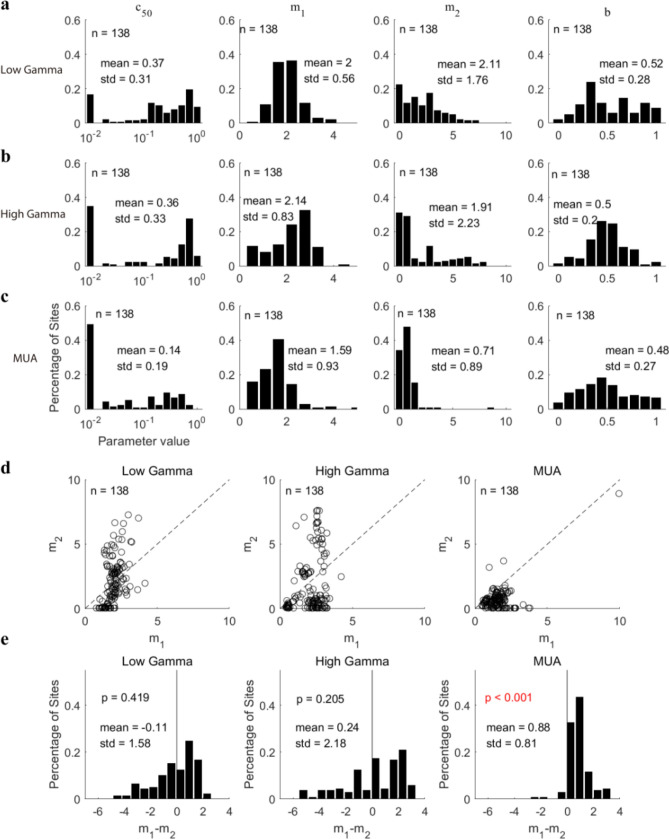
Figure 9.
Analysis of the fitting parameters in the normalization model for sites with all signals good (low gamma, high gamma, and MUA, n = 138). (a) Shows histograms of various fitting parameters (c50, m1, m2, (b) for low gamma. Subfigures (b) and (c) are similar to (a), but for high gamma and MUA respectively. (d) presents scatter diagrams of the parameters m1 and m2 for three signals. (e) shows histograms of the difference between m1 and m2 for these three signals. The bootstrap method was used to test whether the distributions were significantly biased from 0 (black solid line). All the significant correlations were labeled as red fonts.

