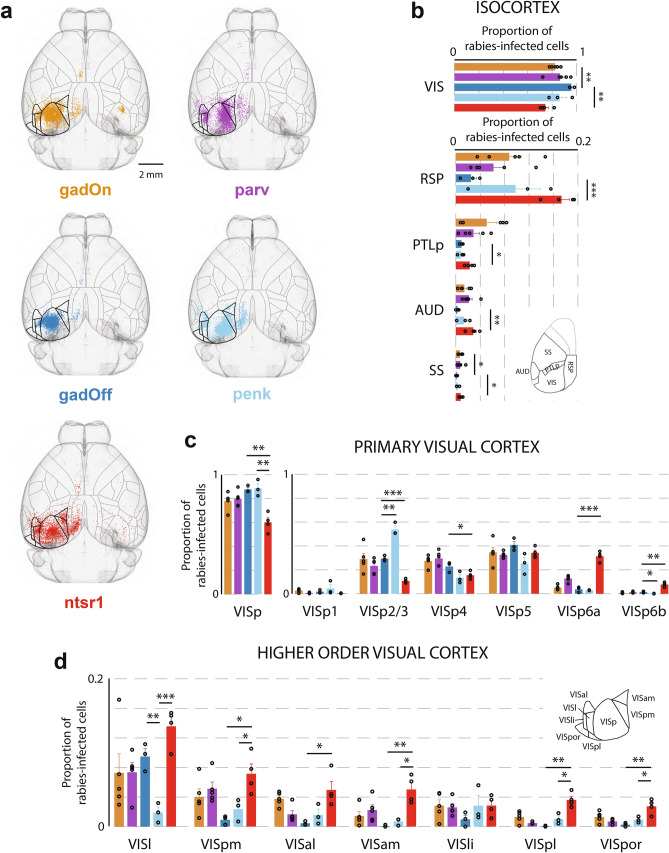
Figure 2.
Distribution of presynaptic input from isocortex to primary visual cortex (VISp). (a) Horizontal projections of a template brain, showing the positions, after registration, of presynaptically connected cells within the isocortex, for each mouse line. The number of cells displayed for each line is the same, and has been normalized to the line with the fewest inputs (gadOff) by randomly sampling from all isocortex inputs. Both contra- and ipsilateral inputs are displayed, although only ipsilateral inputs were used for analysis. Horizontal surface projection of the segmentation is shown. Areas comprising visual cortex are highlighted with thicker outlines. (b) Proportion of labelled rabies-infected cells in ipsilateral top-level areas of the isocortex, expressed as a fraction of all cells in isocortex. Inset, location of RSP, PTLp, AUD and SS on the horizonal surface projection of the segmentation. (c) Left, proportions of labelled cells in VISp (expressed as a fraction of all cells in visual cortex); right, proportions of labelled cells in different layers of VISp (expressed as a fraction of all cells in VISp). (d) Proportions of labelled cells in subregions of the visual cortex (higher visual areas), expressed as a fraction of all cells in visual cortex. Inset, location of each visual area in the horizontal segmentation. Error bars show the S.E.M. and data from individual mice are shown as dots overlaying the bars.

