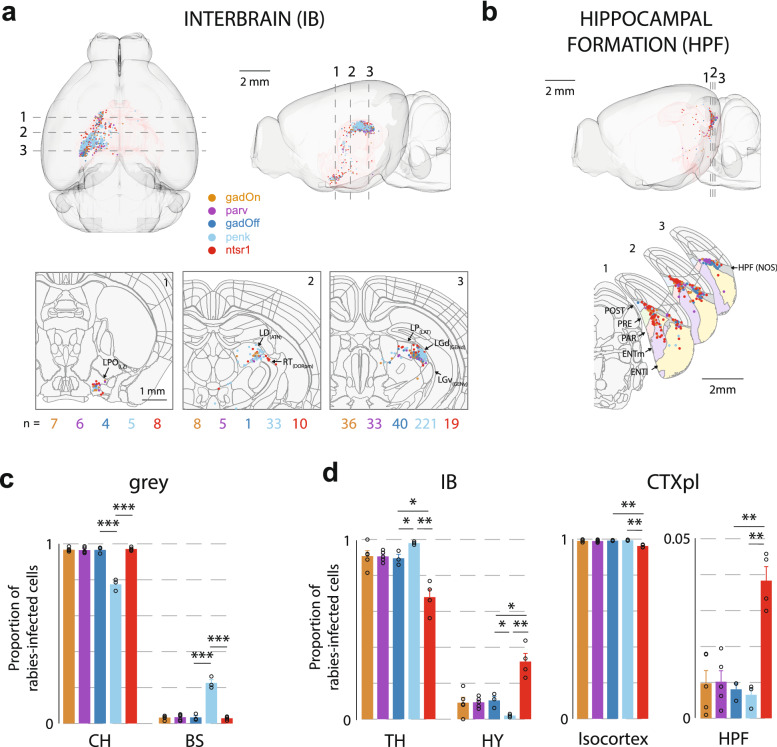
Figure 3.
Distribution of presynaptic input from interbrain (IB) and hippocampal formation (HPF) to VISp. (a) Top, horizontal and sagittal projections, showing the distribution of labelled rabies-infected cells within the IB. Dashed lines indicate location of cross-section images, below. Bottom, coronal cross-sections of the template brain at three locations, with the position of labelled cells in the interbrain. Brain regions are outlined, and cells ± 20 μm anterior–posterior of the cross-section location are shown. Lateral preoptic area (LPO), lateral dorsal nucleus (LD), reticular nucleus (RT), lateral posterior nucleus (LP), and dorsal (LGd) parts of the lateral geniculate complex are indicated (in brackets, the parent regions of these regions). Numbers below indicate the number of cells from each line appearing in the image. (b) Sagittal projection showing the distribution of labelled cells within the HPF. Dashed lines indicate location of cross-section images, below. Below, coronal cross-sections of the template brain at three locations, with the position of labelled HPF cells and brain regions outlined (includes cells ± 10 μm anterior–posterior of the cross-section location). Pre- (PRE), post- (POST) and para- (PARA) subiculum, as well as lateral (ENTl) and medial (ENTm) entorhinal cortex are indicated. The dark grey region indicates a region labelled HPF with no further subdivision (NOS not otherwise specified). (c) Proportion of rabies-infected cells within the subregions of the interbrain (IB) and cortical plate (CTXpl). Error bars show the S.E.M. and data from individual mice are shown as dots overlaying the bars.

