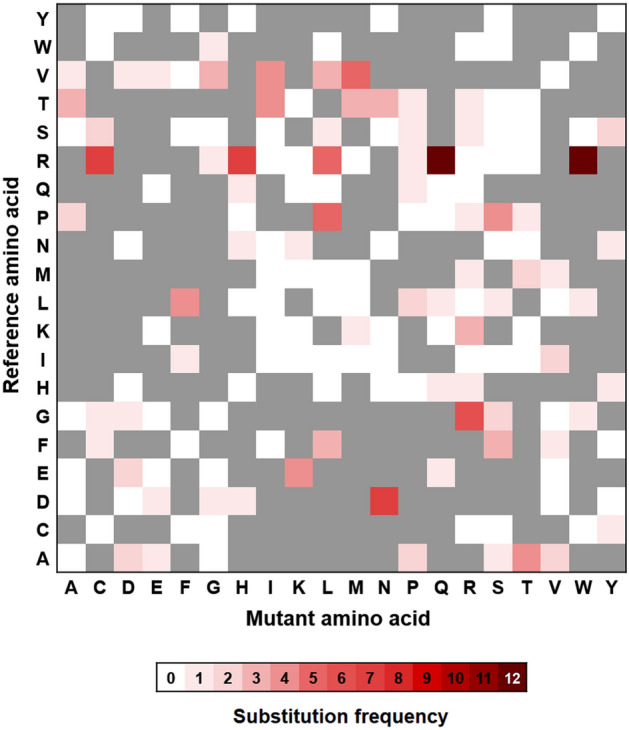
Figure 1.

The Amino acid substitution heatmap. The one-letter codes of amino acids at the left and bottom side of the map correspond to the reference and mutant amino acids, respectively. A color index (white to red) was assigned for amino acid substitutions according to the number of their occurrences ranged from 0 to 12. The gray blocks show the amino acid replacements that are not allowed to occur by single nucleotide substitution.
