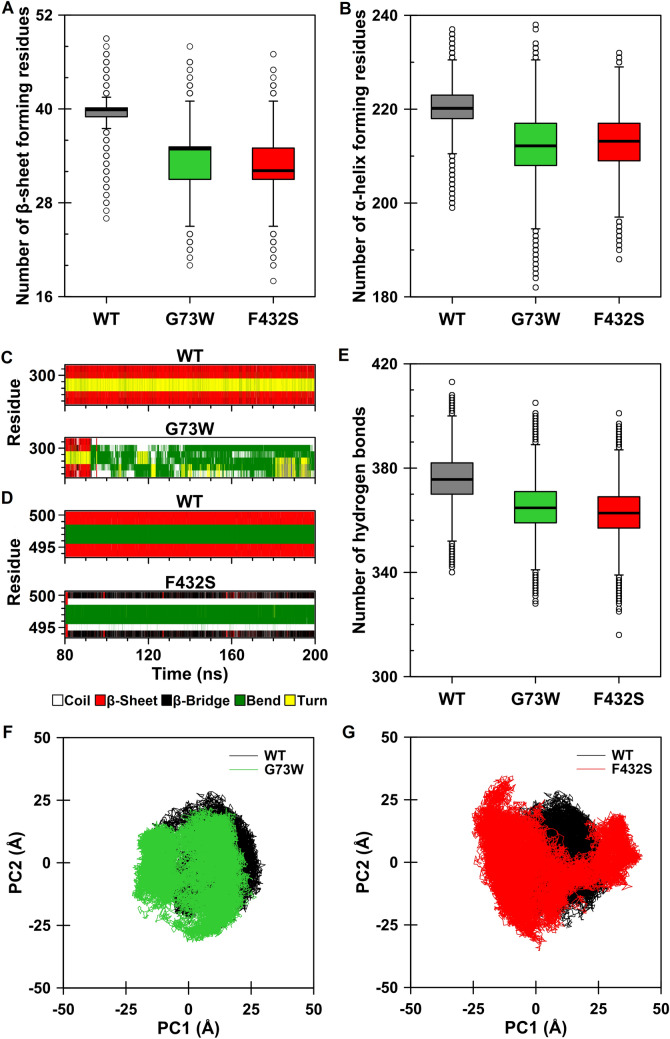
Figure 7.
Trajectory analysis of the wild-type, G73W and F432S CYP1A2 proteins during the analyzed time frames (last 120 ns). (A,B) Number of β-sheet and α-helix forming residues. Box plots for WT, G73W and F432S are shown in dark gray, green and red, respectively. (C,D) Time-dependent secondary structure profile of β-sheets 3′ and 4 for G73W and F432S variants, respectively. (E) Comparison of the intramolecular hydrogen bonds. (F,G) Projection of the motion of the protein in phase space along the first two principal eigenvectors. Comparison of G73W (green) and F432S (red) with WT (black) are presented.

