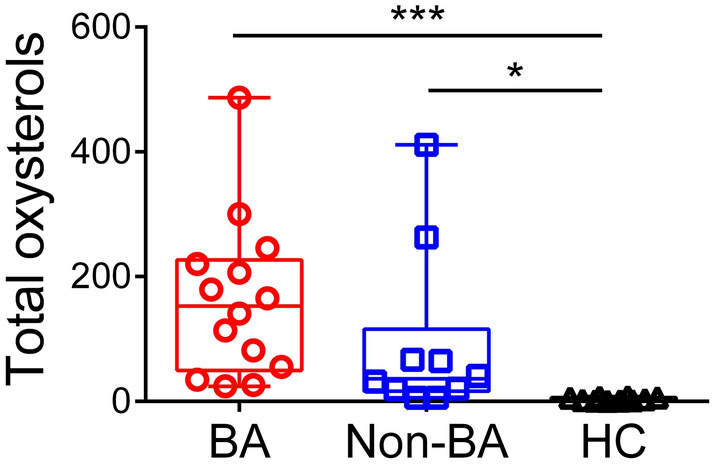
Figure 1.

Urinary total oxysterols among BA, non-BA, and HC. Urinary total oxysterols are shown for subjects with biliary atresia (BA) and non-biliary atresia cholestatic controls (non-BA), as well as healthy controls (HC). Units are μmol/mol creatinine. Horizontal lines in the middle of boxes indicate medians, while tops and bottoms of boxes represent 75th and 25th percentiles, respectively. Whiskers above and below boxes represent maximum and minimum, respectively. *P < 0.05; ***P < 0.001.
