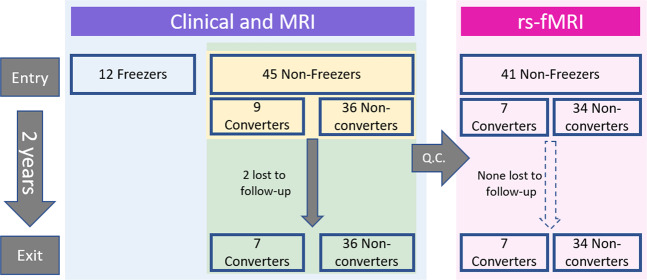
Fig. 1. Study flowchart and analyses.
Forty-five non-freezers were included and followed up over two years. Of these, 9 participants developed FOG during these two years and were classified as converters. Twelve freezers were also included as a positive control group at study entry. Colored boxes indicate participants included in the main analysis (blue), prediction analysis (yellow), correlation analyses with clinical measures and thalamic sub-nuclei volumes (green), and functional connectivity analyses (pink). MRI Magnetic Resonance Imaging, rs-fMRI resting state functional MRI, Q.C. quality control for high motion.

