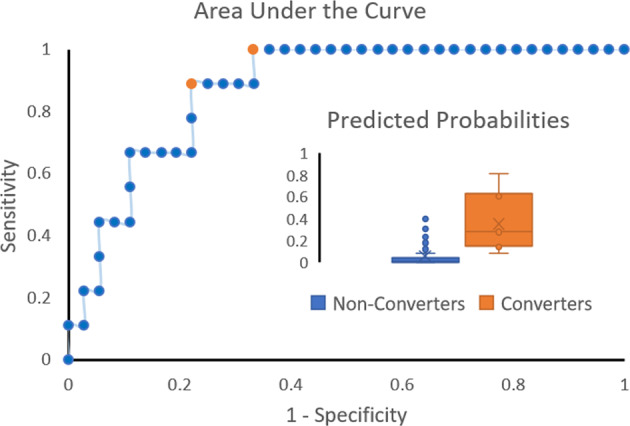
Fig. 3. Prediction of conversion to FOG over two years.

Area under the curve of the FOG conversion model including sex, daily levodopa equivalent dose, and left thalamus local volume is shown. The area under the curve of the model was 0.87 and the Brier score was 0.11. Optimum performance was achieved at two Youden’s points (in orange), probability cutoffs of 0.09 (sensitivity: 100%, specificity: 66.7%) and 0.19 (sensitivity: 88.9%, specificity: 77.8%). Box and whisker plots of predicted probabilities are also shown for non-converters and converters along with median (horizontal line) and mean (x), showing good separation of the two groups (inset).
