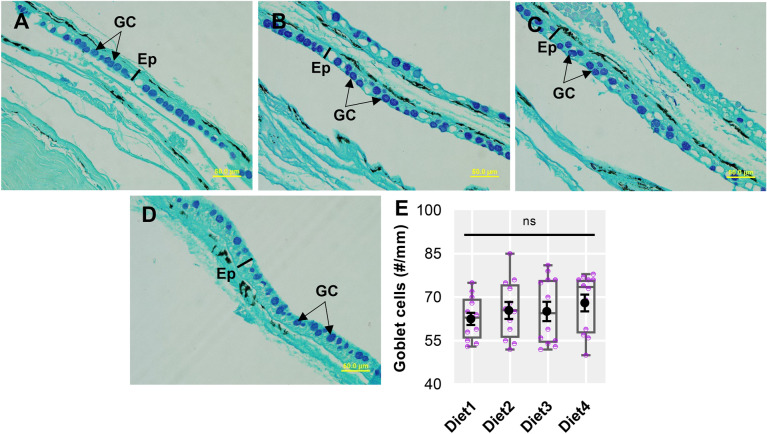
Figure 3.
Representative skin micrographs (A–D, AB-PAS stain, 40 × magnification) and number of mixed goblet cells of barramundi fed Control (Diet1), 80PBM10TH+10HI (Diet2), 85PBM5TH+10HI (Diet3), and 90PBM5TH+5HI (Diet4) for six weeks. Variation in the mixed types of goblet cells in the skin (E) of barramundi fed test diets. Multiple comparisons were performed by one-way ANOVA analysis followed by Dunnett’s multiple comparisons test. ns denotes not significant. GC, goblet cell and Ep, epidermis.

