Figure 4.
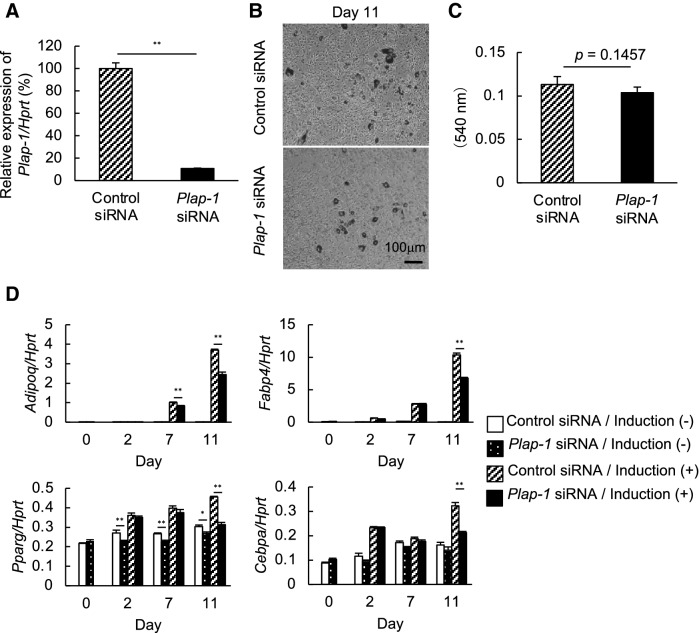
Adipocyte differentiation of Plap-1 knock-down 3T3-L1 cells by siRNA. (A) Real-time PCR analysis was performed to confirm Plap-1 knock-down by siRNA in 3T3-L1 cells. Data are represented as relative expression to control siRNA. Values represent the mean ± SD triplicate assays (n = 3). (B) Oil Red O staining of Plap-1 knock-down and control 3T3-L1 cells was conducted after adipocyte differentiation. (C) Quantitative lipid assay of Plap-1 knock-down and control 3T3-L1 cells was performed after Oil Red O staining (n = 4 in each group). Values represent the mean ± SD (n = 4). (D) Real-time PCR analysis was performed to examine adipogenic gene expressions of Plap-1 knock-down 3T3-L1 cells during adipocyte differentiation. Results show the mean ± SD of triplicate assays (n = 3). *: p < 0.05, **: p < 0.01.

